How did Logility Network Optimization calculate those costs so easily?
Why Reference Data
Based on decades of experience and a few thousand models built-->we believe success comes from applying a consistent, statistically sound, and heterogeneous market datasets to model costs. Our customers see two key benefits from this:
- They are saved the challenge and risk associated with providing thousands (or 10s of thousands) of rows of statistically consistent freight and location data
- Data gathering time lags shrinks from 12 weeks to 1 week and new scenarios can be built in minutes (rather then requiring another data search)
Method
When a freight lane is created in Logility, it will automatically find a market cost, time, and distance for the user. Also, when a user puts a facility in a given location, Logility can add the average labor and lease rates. All we ask of the user is to calibrate this data to your actual costs and product characteristics.
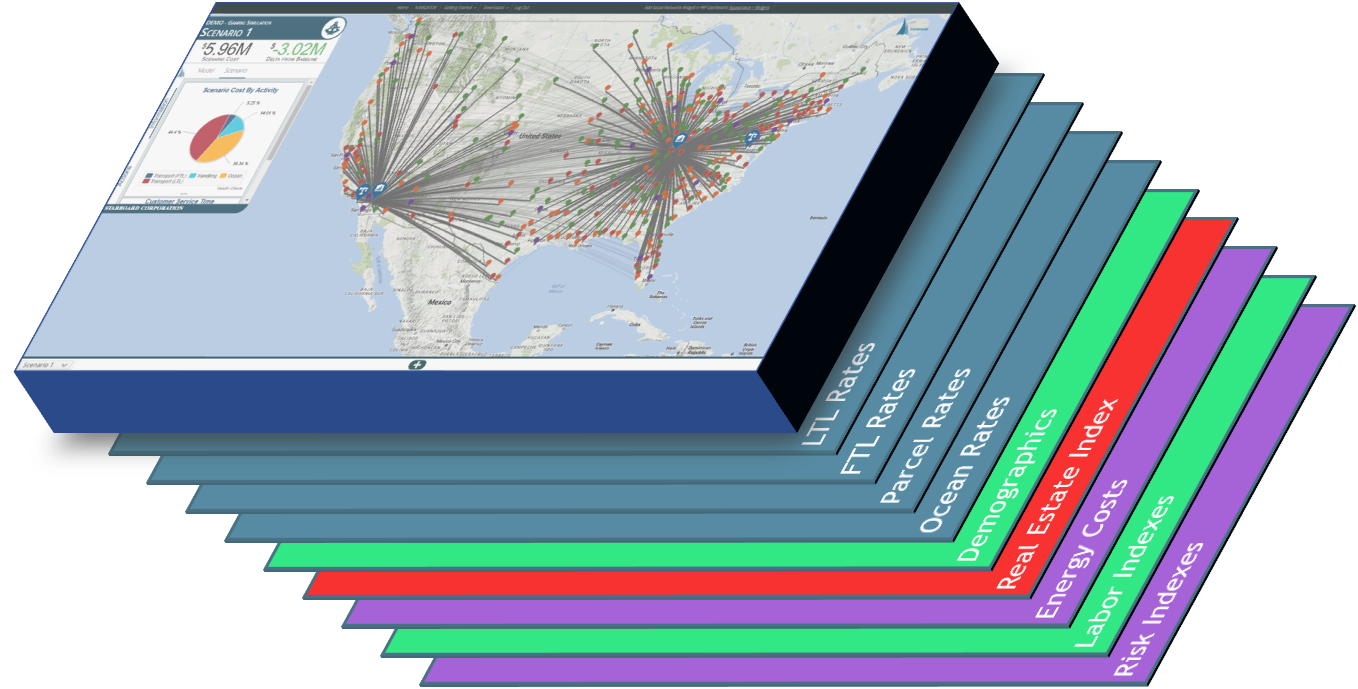
Reference data is like a layer under each map that allows any nodes placed on a map to pick up its local data. This allows us to get very granular. For example if we know the market truckload rate between an origin and destination, we can calibrate it based on your known truckload rates and how much of a product fits on a truck, then we can calculate a precise rate for that origin-destination pair. Or for any origin-destination pair.
Transportation Reference Data
FTL or Truckload
Our full truckload rates are based on historic costs per unit of distance. They reflect a long-running average. The times and distances are actual drive times and distances. FTL rates are reported by Starboard as a cost per unit per truck. $/mile/truck lane costs are computed as COST (cost/unit)= [reference cost] * [distance] / [Units per Truck]
Example: $.02 / unit = $4.00 / mi * 200 mi / 40000 units per truck.
FTL costs are dependent on settings for:
- Units/truck (Configuration>>Products>>Units/Truck)
- Minimum shipment cost (Configuration>>Transportation>>Minimum Cost)
- Driving distance between the origin and destination
- Reference data rate between origin and destination
LTL
We input an LTL tariff that can be calibrated by weight break and product density. Times are an average across several carriers and are represented in whole days. We use standard weight buckets provided by LTL carriers. Accordingly, the same per unit weight between a particular origin and destination for a particular product density will be the same for the following weight buckets:
| 0-500 lbs | 500-1000 lbs | 1000-2000 lbs | 2000-5000 lbs | 5000-10000 lbs | 10000-20000 lbs | >20000 lbs |
LTL costs are dependent on settings for:
- Units per order (Configuration>>Products>>Units/Order)
- OR Shipment Size at the customer node (will override above if given)
- Minimum shipment cost (Configuration>>Transportation>>Minimum Cost)
- Origin and destination zone tariffs
- Product Density Class (Configuration>>Product>>Density Class)
Ground Parcel
We use standard carriers and zones to calculate a list rate for parcel. You will probably have to provide your own discount.
Parcel costs are dependent on settings for:
- Units per order (Configuration>>Product>>Units/Order)
- OR Shipment Size at a customer node (will override above if given)
- Origin and destination tariffs
Intermodal
Inter-model times are variable so we have added in an approximation for these based on FTL rates. If you have your own lane by lane rates, you are able to enter these in to be more precise.
FTL f(x)
FTL f(x) is the mode used that is purely based on a cost per distance traveled. The rest of the modes rely on reference data.
Labor/Lease Reference Data
The table below can be found via the Facility tab of the Configuration settings accessed by selecting the Model Manager.
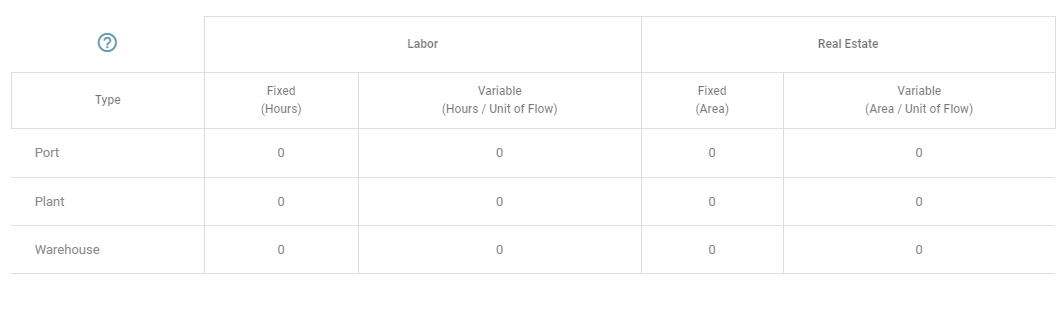
Labor
Labor rates are derived from census data and represent an average industrial labor cost per hour. These usually vary by metro area. For enterprise customers we can break this all the way down to zip code prefix. You can configure labor rates as either a fixed or variable cost.
Example: If your model captures a fixed interval of time - for instance, 100 employees working for one year - then you might set the Fixed (Hours) field to be 100 * 2000 = 200k. Thus, 200k hrs of the average industrial labor cost per hour at each location will be added to the facilities' operating expenses.
Example: If you have a good grasp on the productivity of labor at your facilities - for instance, 100 units might be produced in one hour of labor - then you might set the Variable (Hours / Unit of Flow) field to be .01. Thus, every unit which flows through this facility will contribute .01 * the average industrial labor cost per hour at each location to the facilities' operating expenses.
Lease
Lease rates are derived from commercial real estate reports and census data. They represent an average commercial real estate cost per area. These usually vary by metro area. For enterprise customers we can break this all the way down to zip code prefix. Note, leasing rates are given in $/sqft/yr.
Example: If you are leasing the facilities in your model for one year - for instance, each facility might be 10000 sqft - then you might set the Fixed (Area) field to be 10k. Thus, the cost of leasing a 10k sqft facility at each location for one year will be added to the facilities' operating expenses.
Example: If you are able to directly translate the square footage of your facilities into productivity - for instance, each facility might require .01 sqft/yr to produce 1 unit - then you might set the Variable (Area / Unit of Flow) field to be .01. Thus, if a facility has a throughput of 1M units, the cost of leasing a 10k (= 1M * .01 sqft/yr) sqft facility at each location for one year will be added to the facilities' operating expenses.
Source of Reference Data
Logility maintains a database of its own proprietary data based derived from public sources, purchased data, and donated data from its select partners. It is representative of the market rates but should always be calibrated against rates that are unique to each individual organization.