Complete Release Notes - Network Optimization
Release Date: 8 May 2026
Summary
- Products List table from Scoreboard is updated to include Total Scenario Cost and Cost Per Unit
Here is what you will see:
-
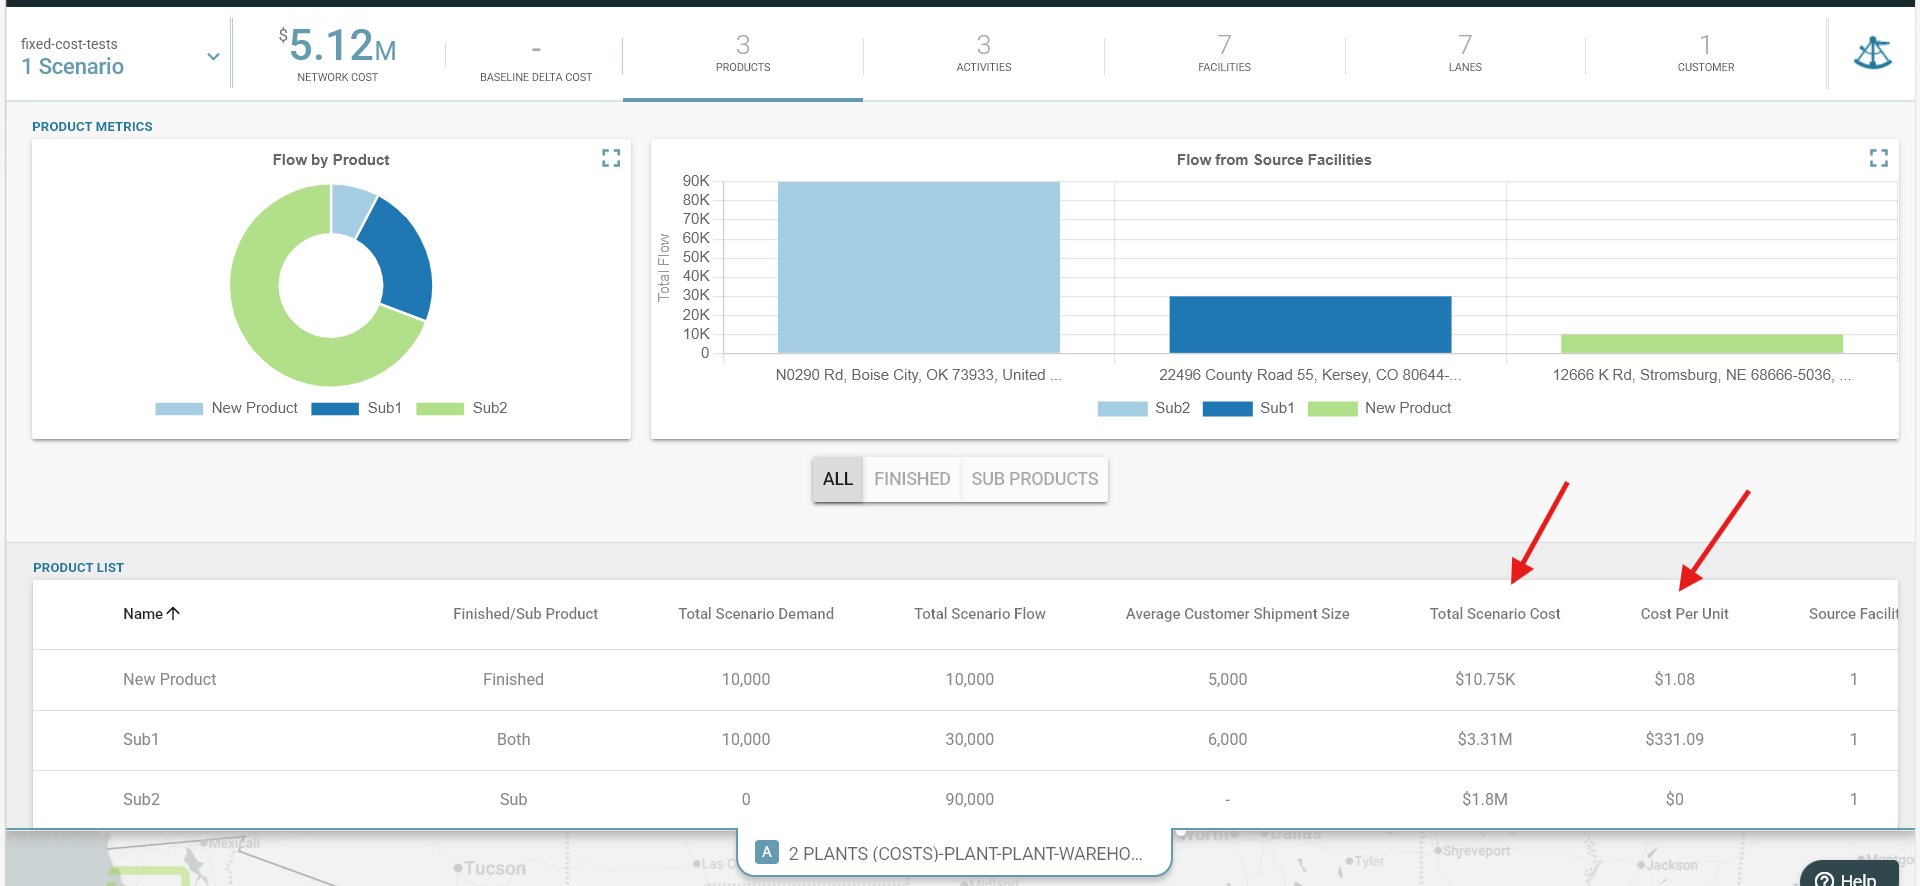
Updated Products List Table: The Products List table from Scoreboard is updated to include Total Scenario Cost and Cost Per Unit.
Total Scenario Cost: Total Allocated Variable Cost to the product.
Cost Per Unit by Product: Unit cost is defined as Total Scenario Cost divided by Total Scenario Demand.
Release Date: 17 February 2026
Summary
- New Shipments Import Capability
- Updated Solver Interface
- Newly Enhanced AI Greenfield Candidate Generation
Here is what you will see:
-
New Shipments Import Capability: The new Shipments Import functionality allows users to ingest shipment data from an Excel workbook to automatically generate key model elements, including Nodes, Lanes, Demand, Sources and Activities.
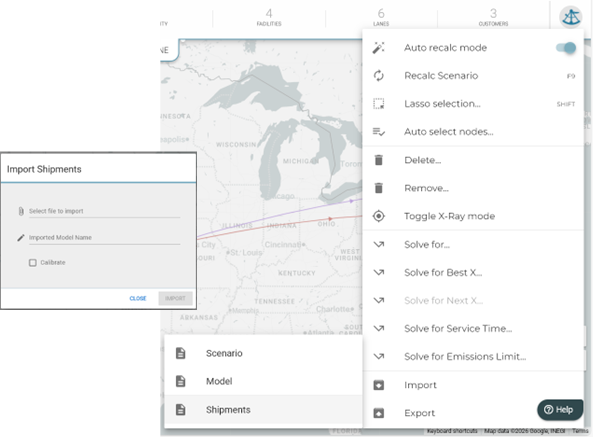
User Interface & Experience: New Dialog Screen: A new "Import Shipments" dialog screen has been introduced, mirroring the existing Excel import process for models or scenarios.
Model Naming: Users can specify a model name during import. If left blank, it defaults to SHIPMENTS_MMDDYYYY. Duplicate names are automatically handled with a versioning suffix.
Calibration Option: The UI includes a "CALIBRATE" check box to perform further reference data calibration using shipment costs.
Import Statistics: Upon completion, the process provides model/scenario statistics and KPIs regarding errors and model elements.
Data Extraction & Validation
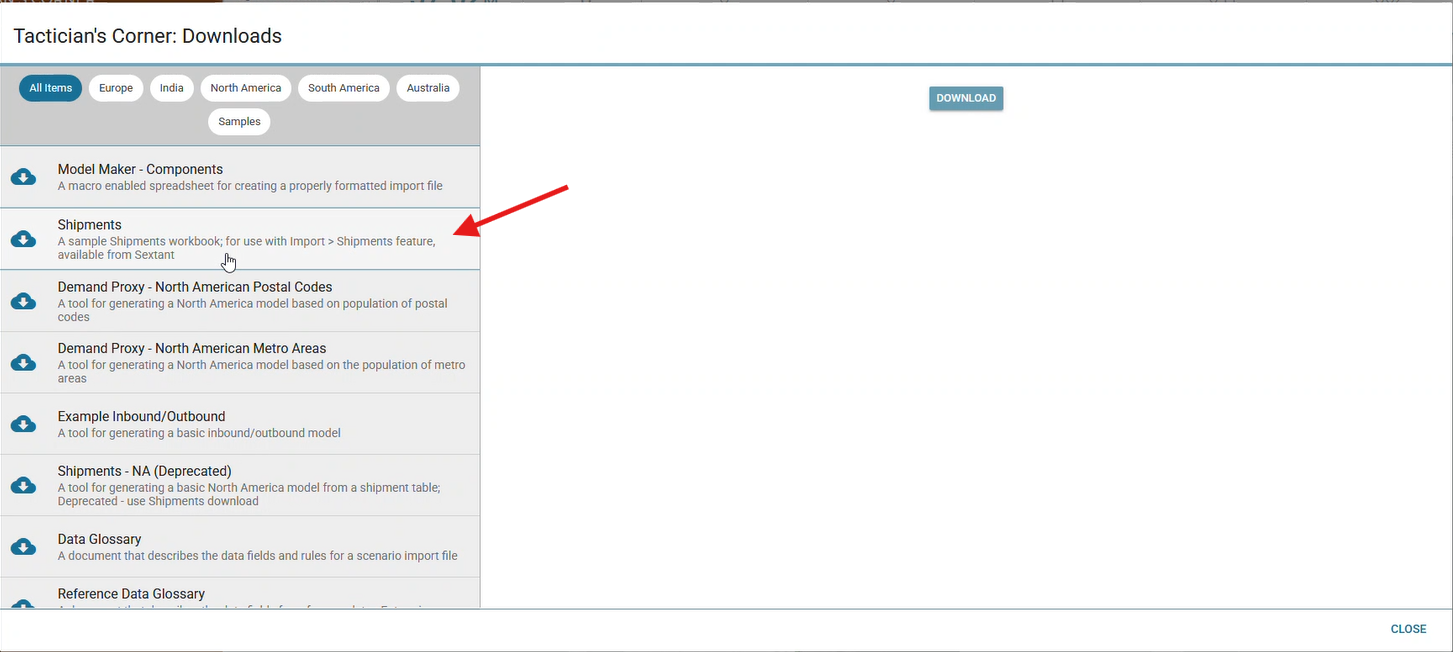
File Requirements: The import requires an .xlsx file containing a single sheet named "Shipments".
Required Columns: The sheet must include columns for Origin/Destination names and postal codes, Shipment Weight, and Shipment Cost. The example dataset and the data requirements are available in Tactician’s Corner Downloads:
Flexible Formatting: Data is successfully imported regardless of column order. Origin and Destination names can have a mixture of upper and lower keys.
Error Handling: Rows are excluded if they contain missing names/postal codes, invalid country codes (must be two characters), or non-positive decimal values for weight and cost.
-
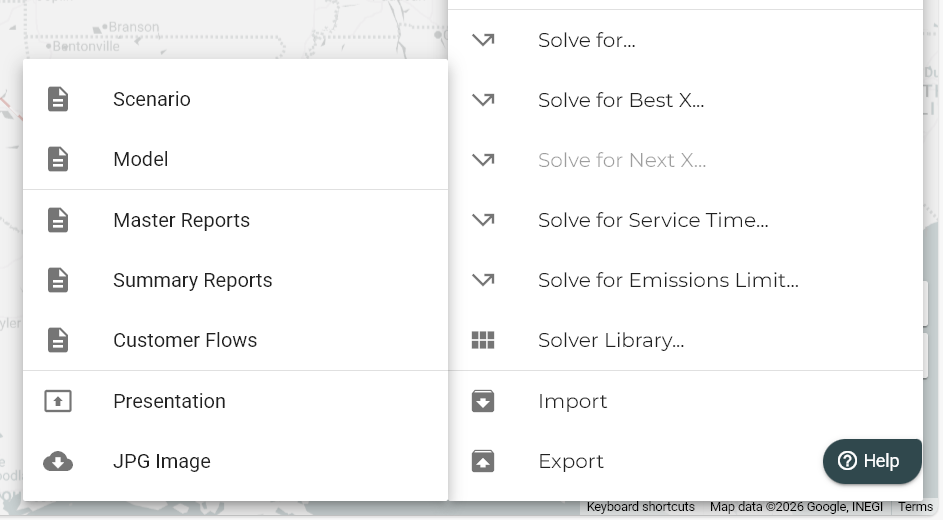
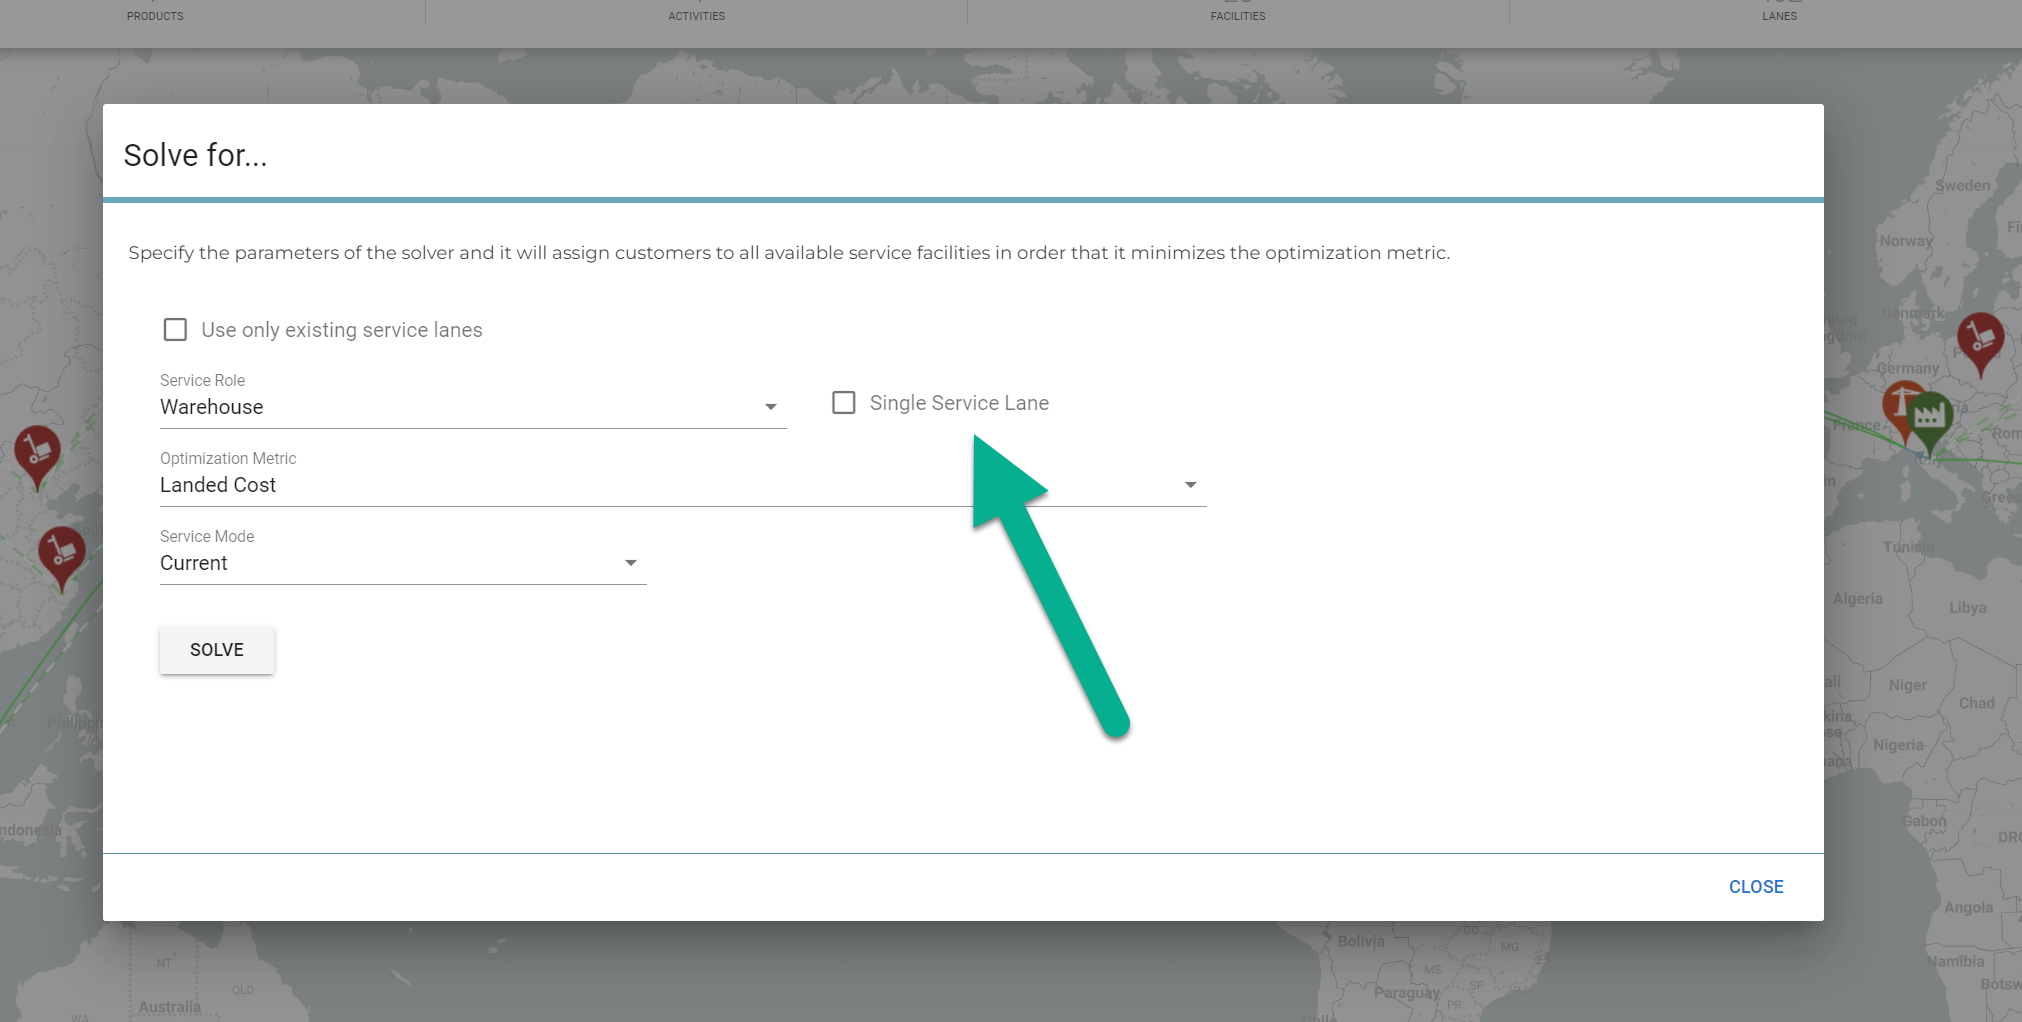
Updated Solver Interface: The solver interface has been redesigned to provide a more intuitive, wizard-style flow and updated styling to align with modern design standards.
User Interface Enhancements:
Wizard Navigation: Current solver windows have transitioned from a single-view layout to a multi-step "wizard" flow, guiding users through the input process.
Updated Styling: Solver views now feature updated styling to closely match the Logility Design System.
Single-View Exception: The "Solve for..." view remains a single-view interface but has been updated with the new styling.
Wizard Steps & Inputs
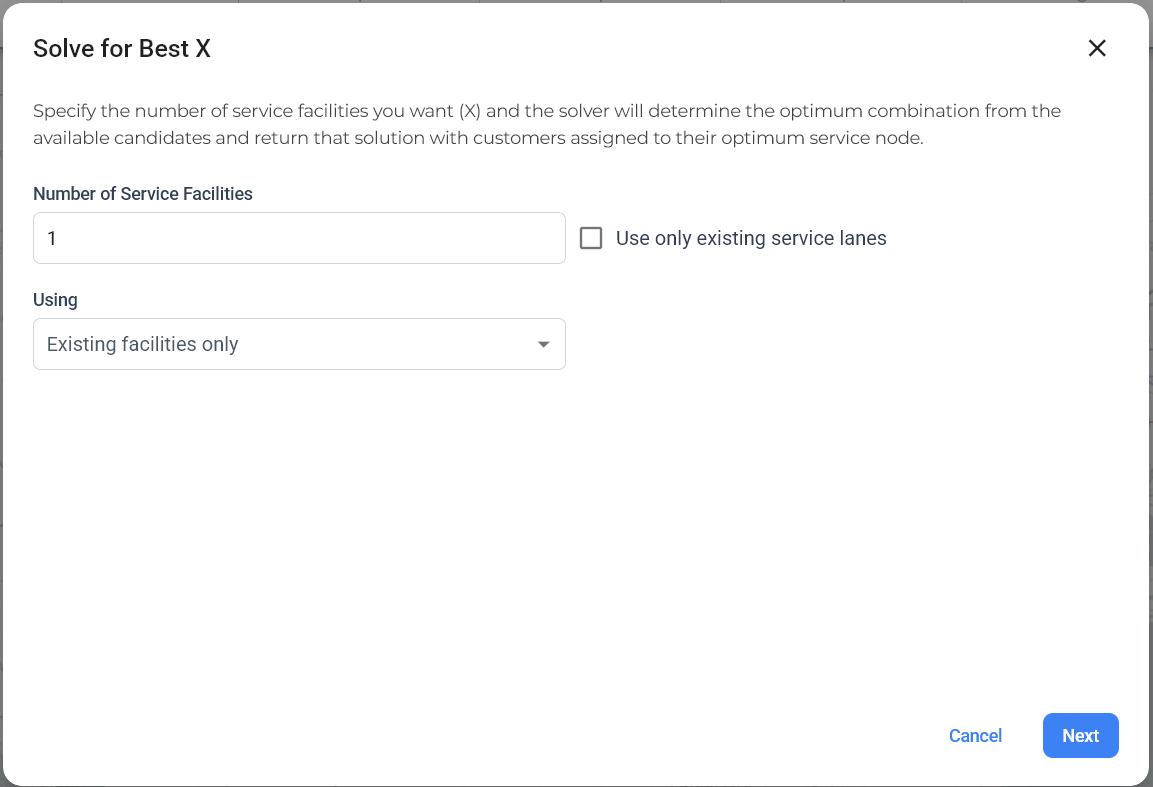
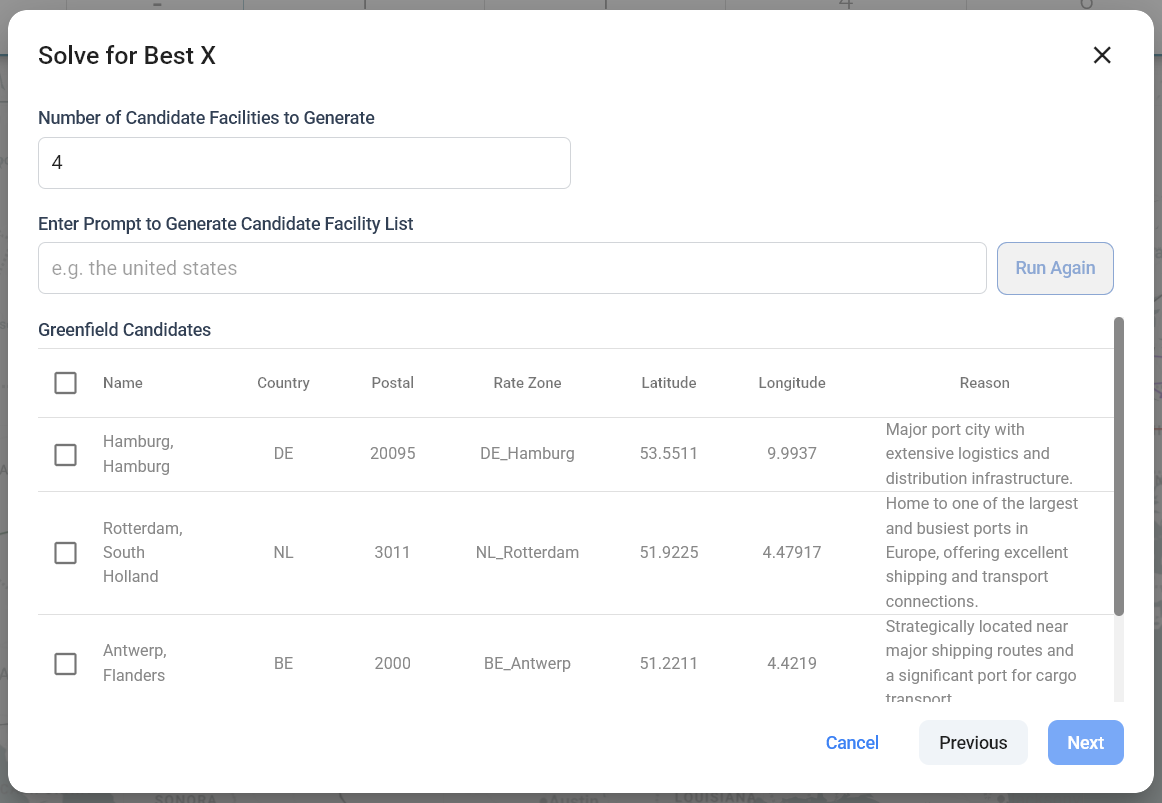
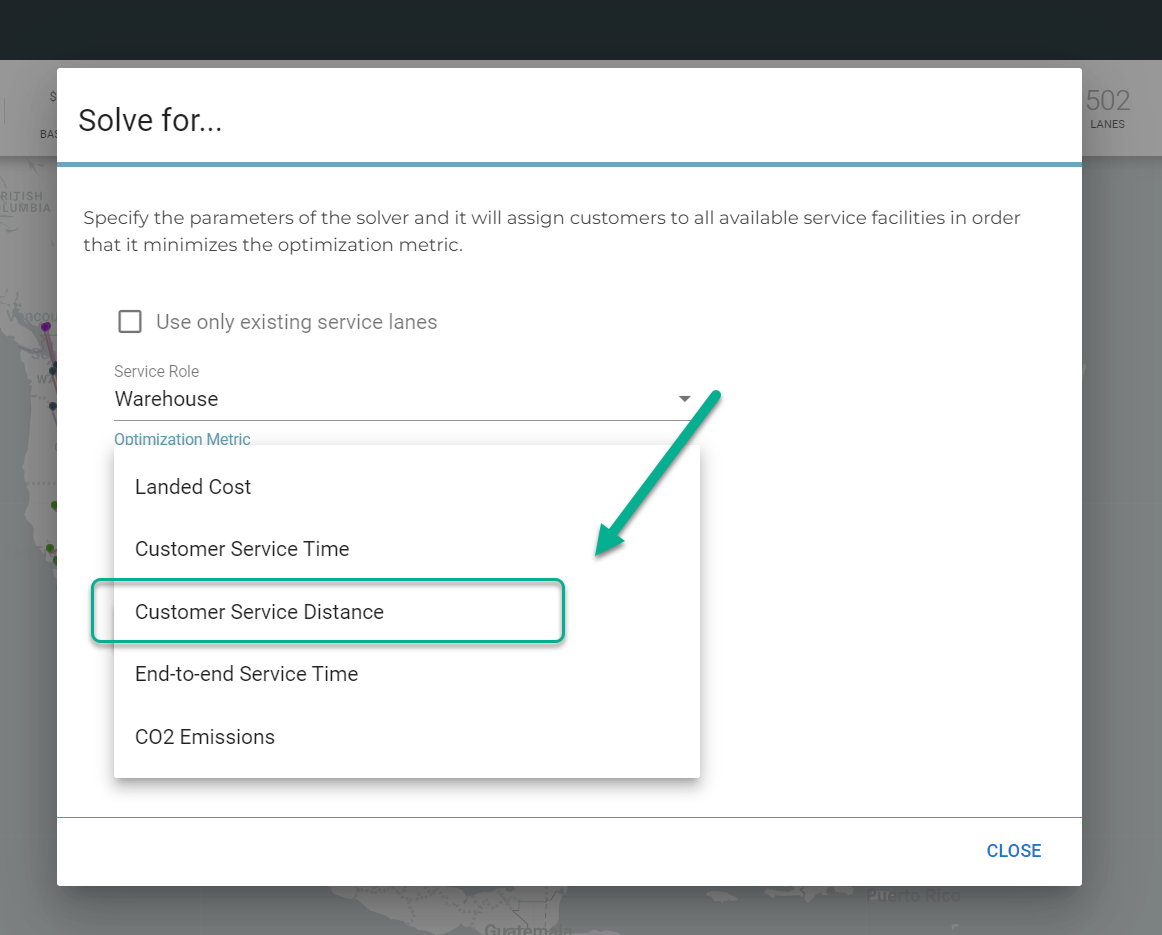
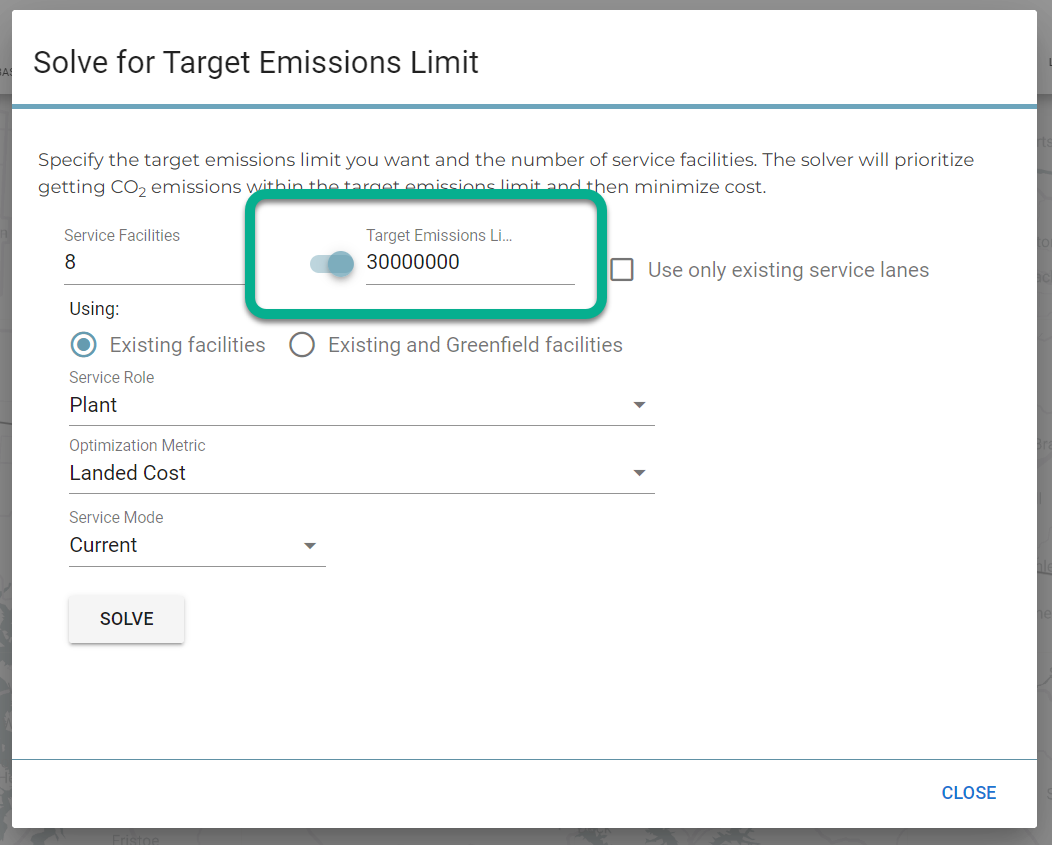
Step 1: Core Parameters: Provides a required "Using" dropdown to select between existing facilities, greenfield list facilities, or AI Greenfield Facilities.
Step 2: Advanced Configuration: This step dynamically varies based on the "Using" selection from Step 1.
- Existing Facilities: Users select service roles (e.g., Warehouse, Port), optimization metrics (e.g., Landed Cost, CO2 Emissions), and service modes.
- Greenfield List Facilities: Users select a "Model Greenfield Facility" from the scenario and a candidate list (e.g., Metro Areas).
- AI Greenfield Facilities (NEW): Provides a text area (prompt) for users to enter prompts to generate candidate facility lists via AI. An eye icon allows users to fetch and select specific candidates.
Final Step: Confirmation: A summary screen displays all entered information for user confirmation before initiating the solve.
-
Newly Enhanced AI Greenfield Candidate Generation: This release introduces a more robust, iterative workflow for generating greenfield facility candidates using AI. The update provides users with granular control over candidate selection, list merging, and logical validation before running the solver.
Iterative List Building & Merging
Dynamic Prompting: Users can enter specific natural language prompts (e.g., “Generate facilities for Northeast region with high demand potential”) to trigger AI candidate generation.
Append Functionality: The system now supports iterative building by allowing users to generate a new list and append it to previously selected candidates, enabling the creation of complex, multi-region scenarios.
Visibility & Manual Selection Control
Candidate Preview: Before finalizing the list, the system displays a comprehensive preview of all AI-generated candidates.
Include/Exclude Logic: Users have manual control to toggle specific facilities on or off, ensuring the final list aligns with specific business knowledge or constraints.
Combined List View: Once the iterative generation is complete, users can view the full combined list in a single, unified view for final verification.
Logical Enforcement & Validation
Candidate Limit Enforcement: Users specify a target number of candidates (e.g., 50). The system monitors the list size in real-time. If the combined list exceeds the user-defined candidate limit, the system provides an immediate warning to ensure the solver remains within optimized performance bounds.
Flexible Navigation
Back: Allows users to return to the previous step without losing progress.
Cancel: Returns the user to the Best X / Next X start screen to adjust the overall strategy.
Release Date: 13 January 2026
Summary
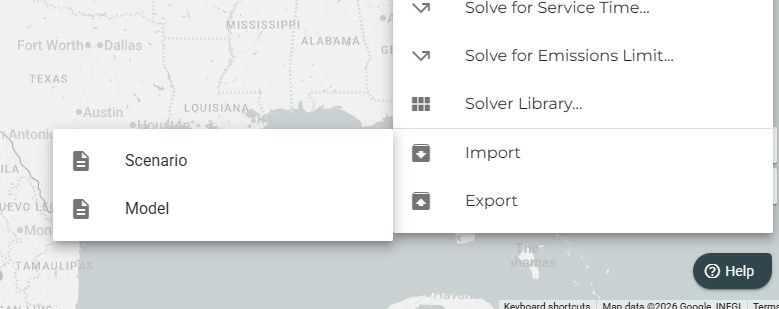
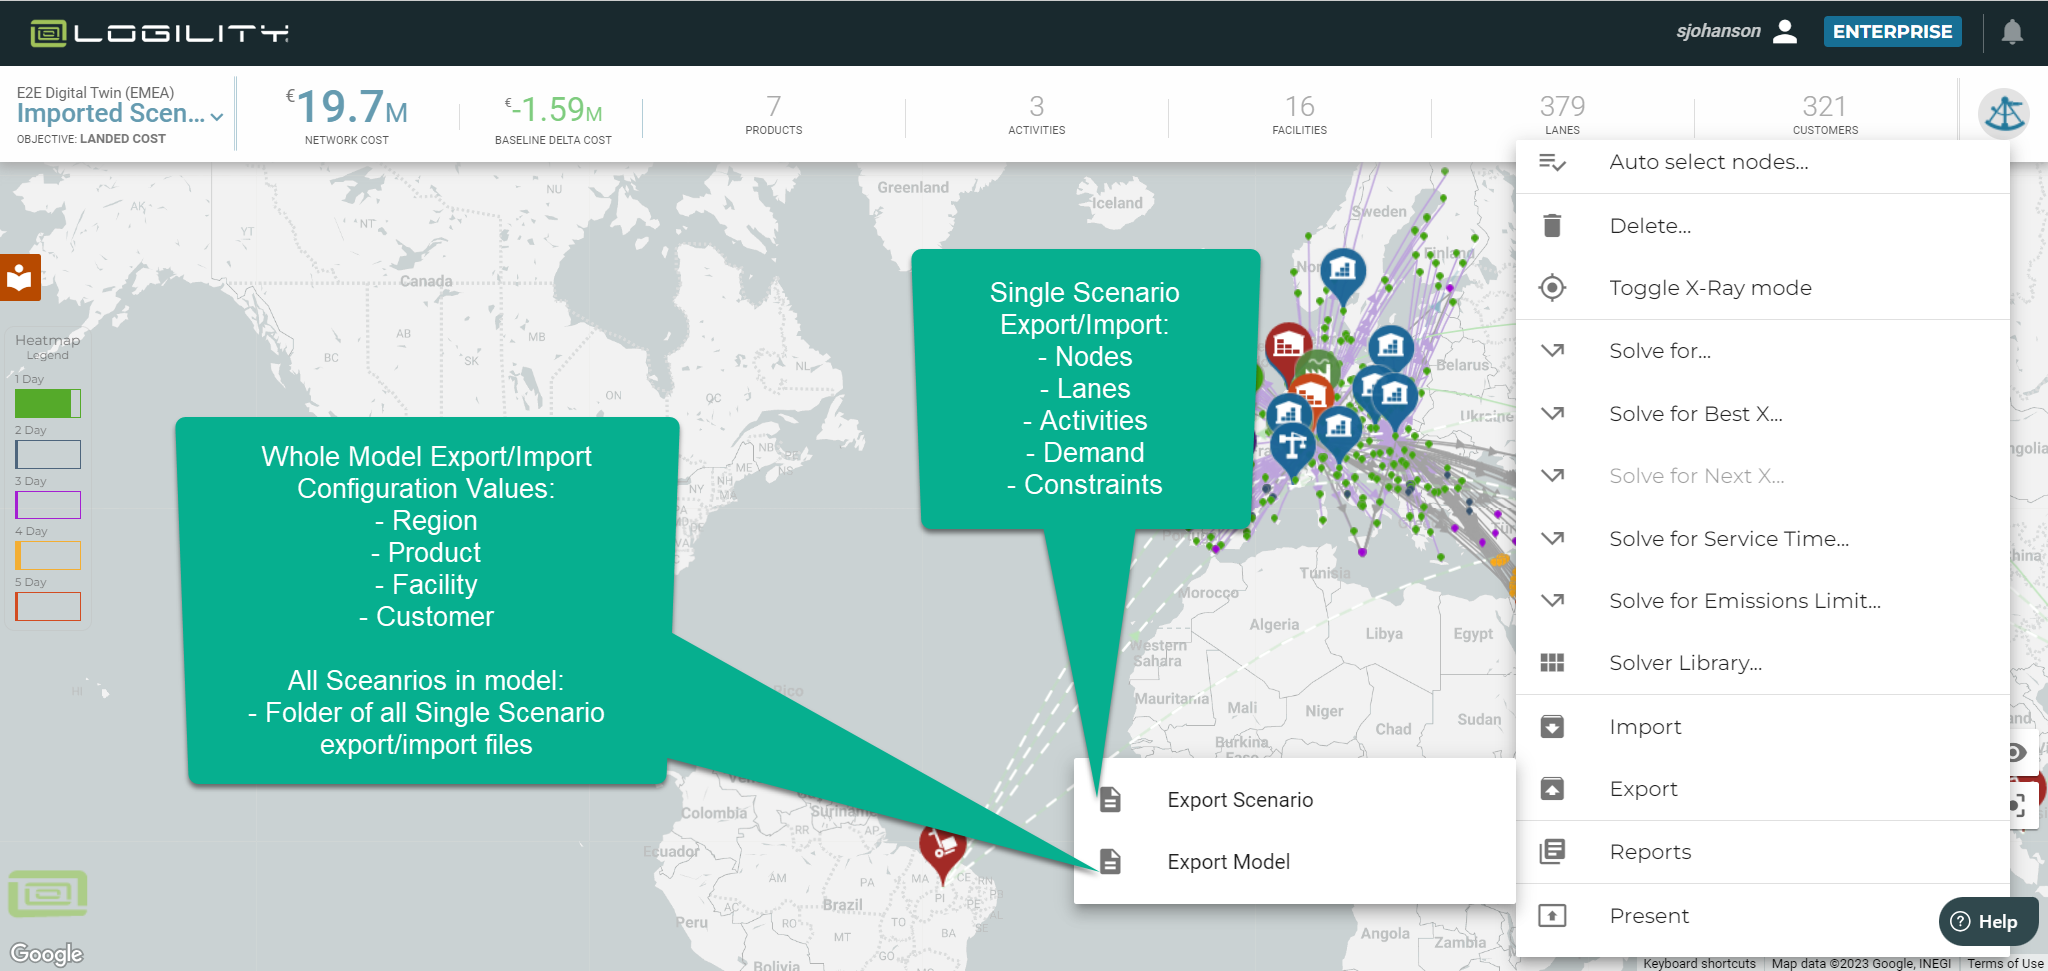
- “Import / Export” Menus Re-organized
Here is what you will see:
-
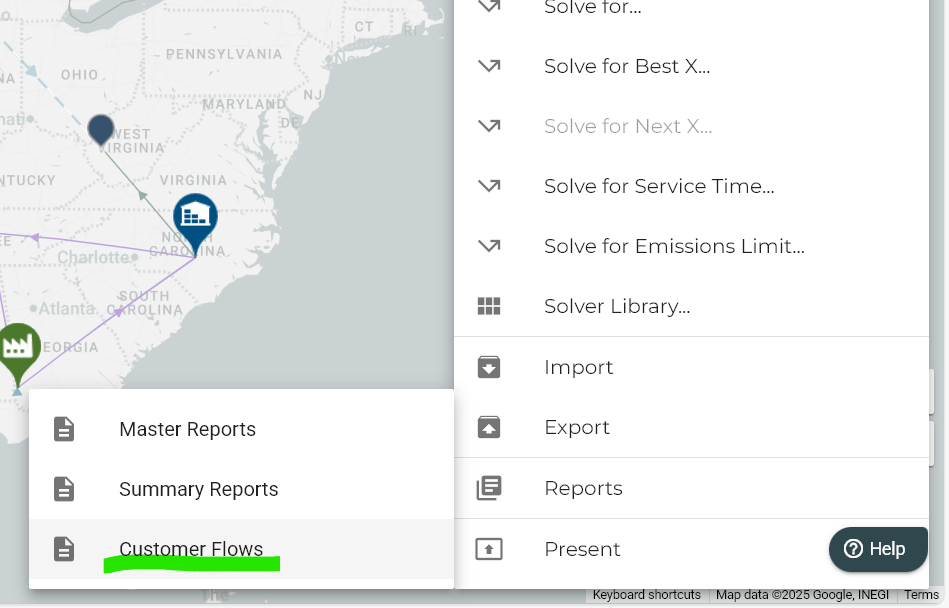
Import/Export Menus re-organized: We’ve reorganized the Import/Export menus to make navigation simpler and more intuitive!
Cleaner grouping: Related options are now grouped together with clear separators for easier access.
Release Date: 2 December 2025
Summary
- New “Customer Flow” Report
Here is what you will see:
-
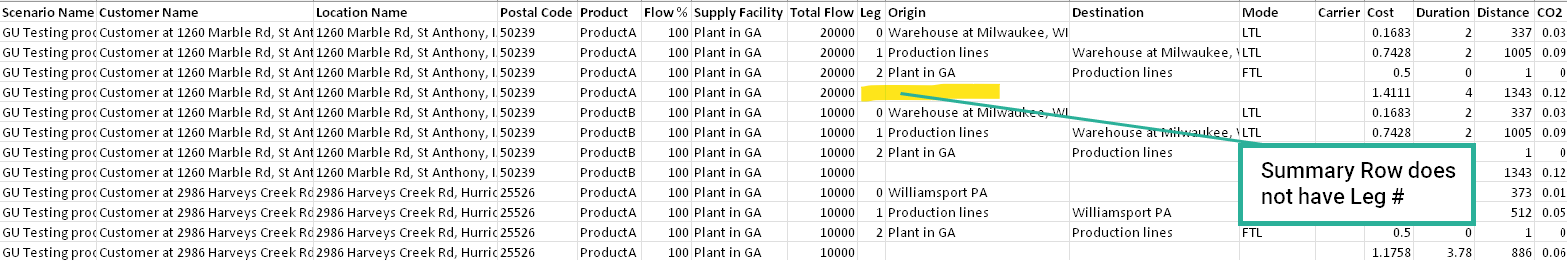
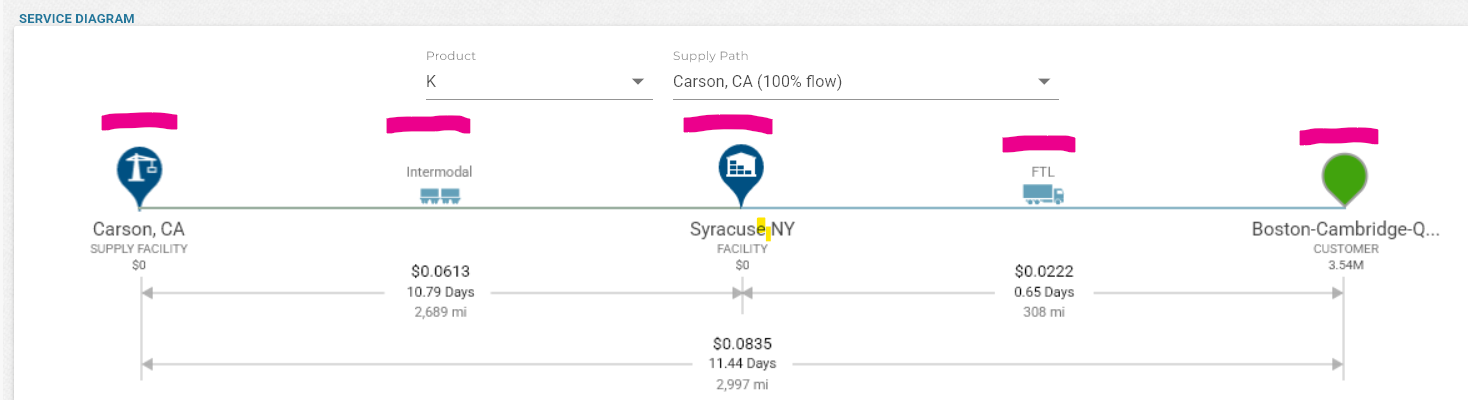
New “Customer Flow” Report: A new report has been added that enables users to more easily examine the way their customers are satisfied, showing end-to-end flow. The report is an excel file that presents the customer service diagram in a tabular form. It lists all the pathways from customers to their sources together with lead time, cost, distance, transportation mode details for each leg of the path, as well as summary information for lead time, cost-to-serve, and total distance for the pathway.
Release Date: 10 November 2025
Summary
- Enhancement for “Focusing” to Model Elements
- Improved “Highlighting” of Selected Nodes
- Filtering and Sorting on Inspector Data Tables
Here is what you will see:
-
Enhancement for “Focusing” to Model Elements: To improve user interaction and navigation, we've introduced a powerful new Focusing capability. This feature allows you to seamlessly link back to the map from customers, lanes, and facilities by clicking on icons within the scoreboard or inspector.
When an icon representing a customer, facility, or lane is clicked:
- The map will automatically zoom and center on the selected node/lane.
- The node/lane will be added to the selected nodes/lanes list.
- The scoreboard and inspector will collapse to provide a clearer view.
This functionality is available in both individual scenario views and the scenario comparison view, making it easier than ever to explore and analyze model entities in context.
-
Improved “Highlighting” of Selected Nodes: We introduced a change in map controls such that when there are one or more items in the selected nodes list, the lanes that have not been selected now have a lower opacity (appear more transparent); This enhancement makes it easier to distinguish between selected and unselected elements without losing context.
You will find that:
- Selected lanes stand out clearly, helping you focus on relevant data.
- Unselected lanes remain visible, but no longer compete for attention.
- The overall map view becomes less cluttered, supporting better decision-making.
-
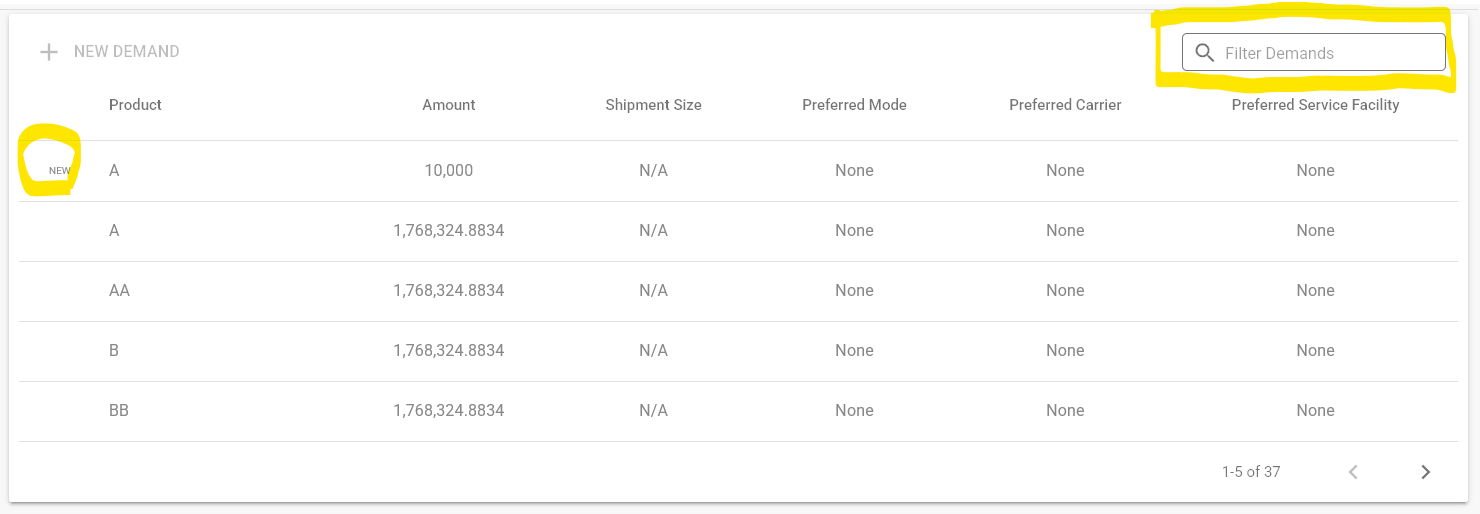
Filtering and Sorting on Inspector Data Tables: New text fields have been added in the customer, facility, and lane inspectors that allow you to filter the contents of various tables, such as customer demands, facility supply, lane activities, and others. The filter searches all visible values in the corresponding table. Additionally, when new Demands, Activities, or Constraints are added, a small "NEW" label appears to the left of the newly added row.
Release Date: 14 September 2025
Summary
- Profit Optimization – Initial Version: a new solver option is introduced with this release: Profit Optimization. When companies have overlapping capacities to produce and distribute items in their supply chain and serve their customers, margins could provide a better alignment against their business goals. In order to accommodate this, we have introduced negative variable and fixed costs in activities depicting value generated through pricing or other gains.
Here is what you will see:
-
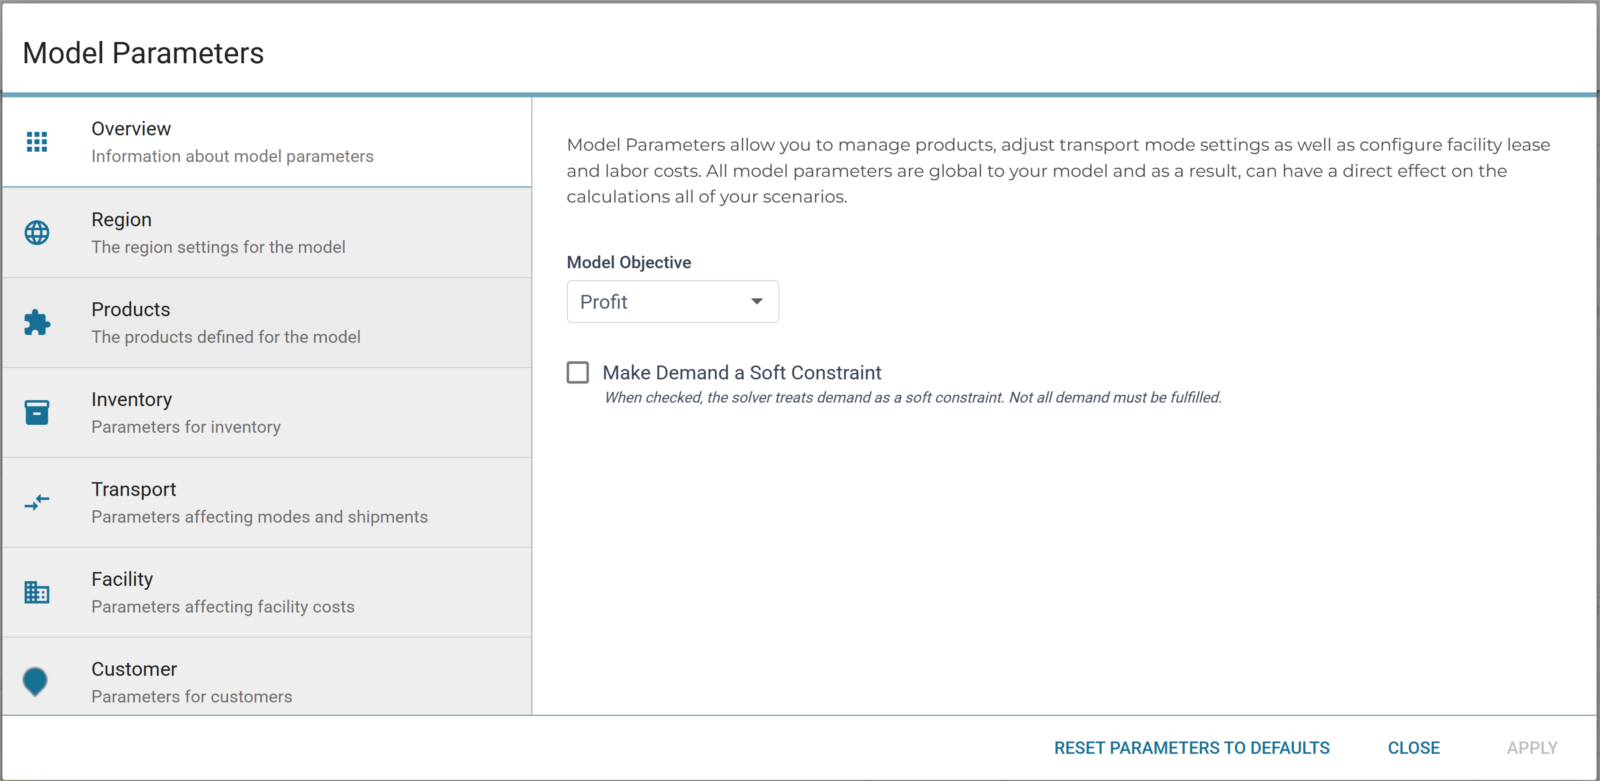
Model Parameters: Model Parameters configuration dialog now allows users to set Model Objective in the overview section as well as enable/disable Soft Demand Constraints (when performing any type of solve operation). In case some customer demand is not profitable to fulfill; users can opt out of meeting the demand by choosing this option.
-
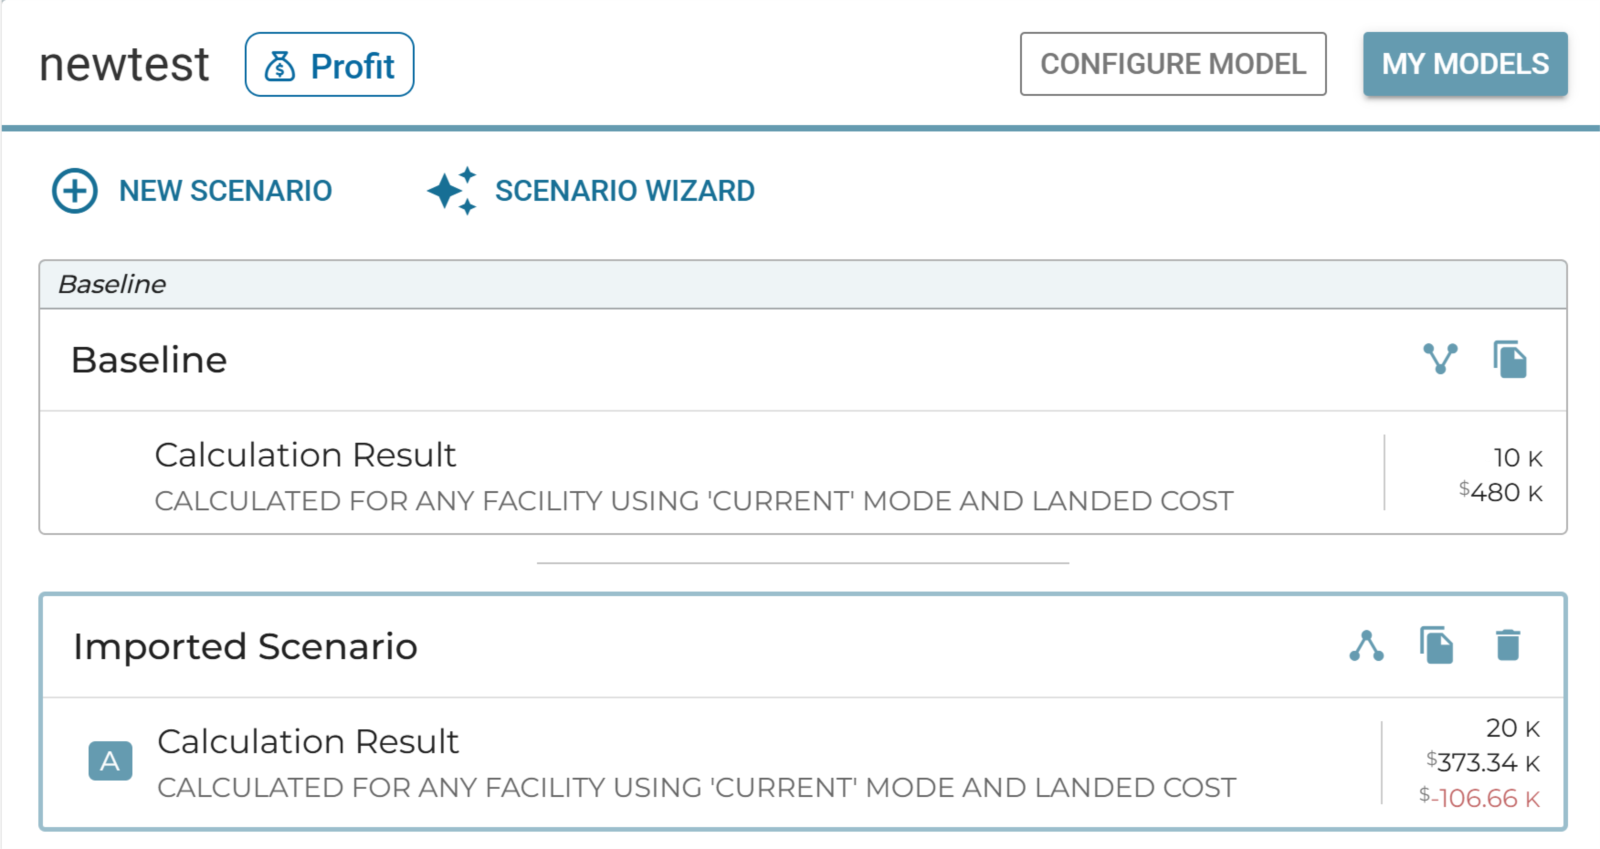
Model Manager: We introduced an icon to depict the model objectives, whether it is cost or profit.
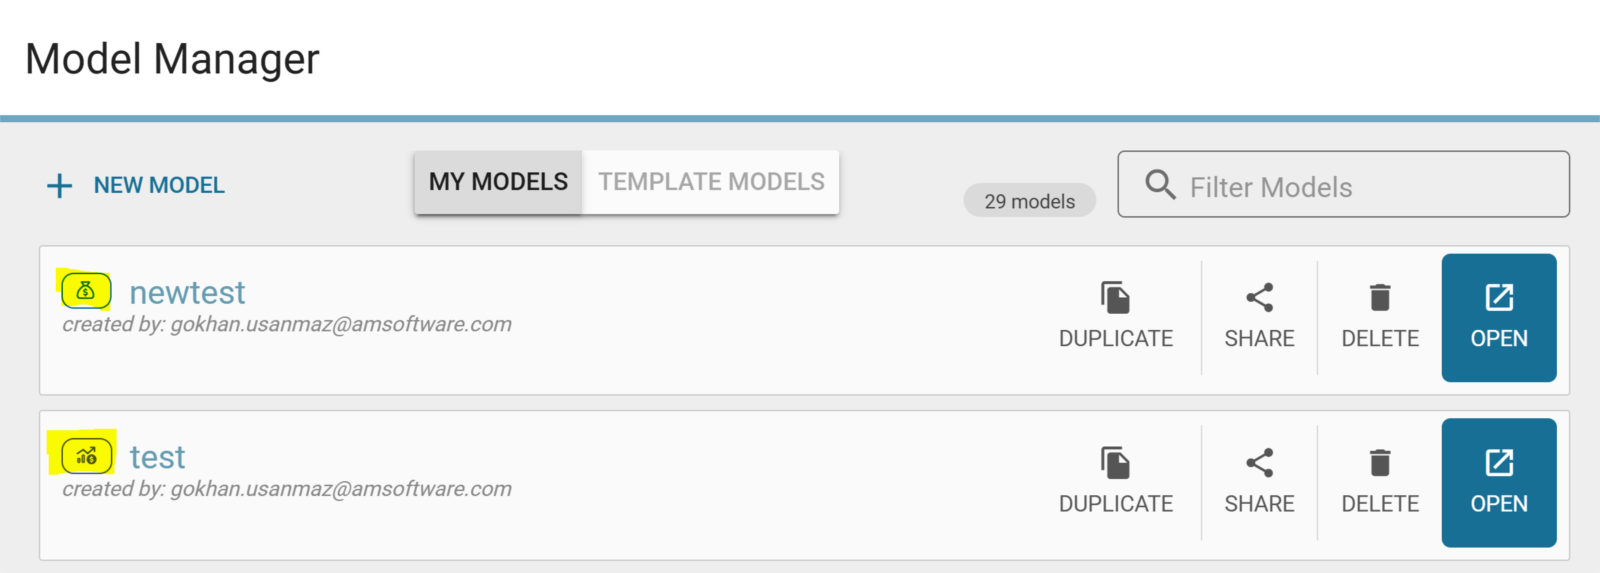
When looking at the list of scenarios, we will see that when we compare to baseline, a higher profit shows up in green, a loss (negative profit) will shown be in red. An icon with the current Model Objective will also appear to the right of the Model name listed at the top of the Scenario List.
-
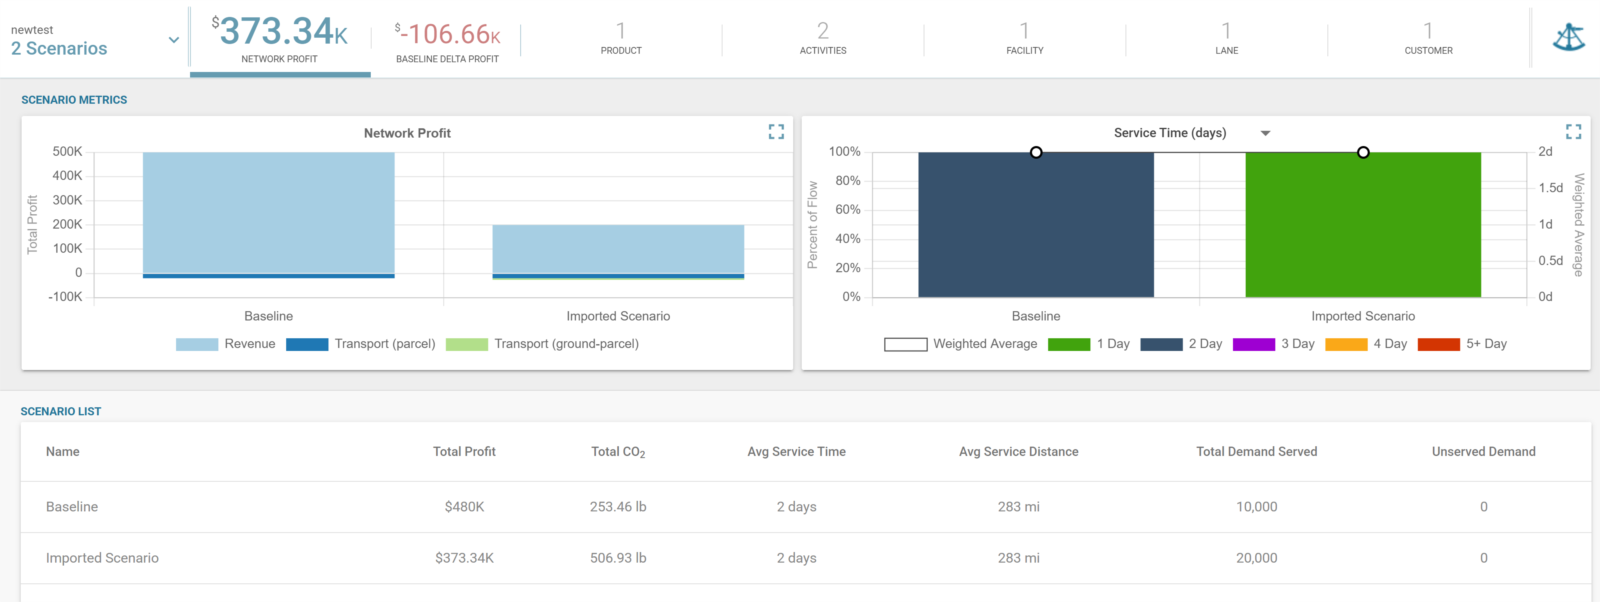
Scoreboard & Scenario Metrics: Once “Profit” is chosen as model objective, we will also see consistent titles throughout the scoreboard and scenario metrics graphs. For instance, instead of “Network Cost”, “Network Profit” will appear as the title. Similarly, we will see “Total Profit” instead of “Total Cost” in the scenario metrics graphs.
Release Date: 23 June 2025
Summary
- Visual Enhancements to Scenario Comparison
Here is what you will see:
-
Updated Scenario Comparison Indicator at the Comparison Tab: To bring more clarity to scenario comparison directions between two chosen scenarios, we updated the current indicators: {A} to {B} where {A} is highlighted being the scenario that is being compared to B. By clicking in the invisible rectangle from the upper left of the "B" scenario (in this pic) to the lower right of the "A", you can swap the scenarios back and forth. As shown below, the comparison tab will initially default as {B} to A.
-
Updated Filtering and Visualization of Changes b/w Scenarios: Scenario comparison legend is updated. The updated legend now has items for Added, Increased, No Change, Decreased, and Dropped. The legend selection still toggles hiding/showing the model elements for each category. One of the new categories, "Added" lanes now has a "dashed" line style. No change for Added nodes. "Dropped" nodes now appear partially transparent. Clicking on the "Increased" and "Decreased" items in the legend used to also hide the nodes/lanes that have been newly added or dropped: that behavior is no longer valid with the new filtering additions.
Release Date: 27 April 2025
Summary
- Scenario Comparison Report
Here is what you will see:
-
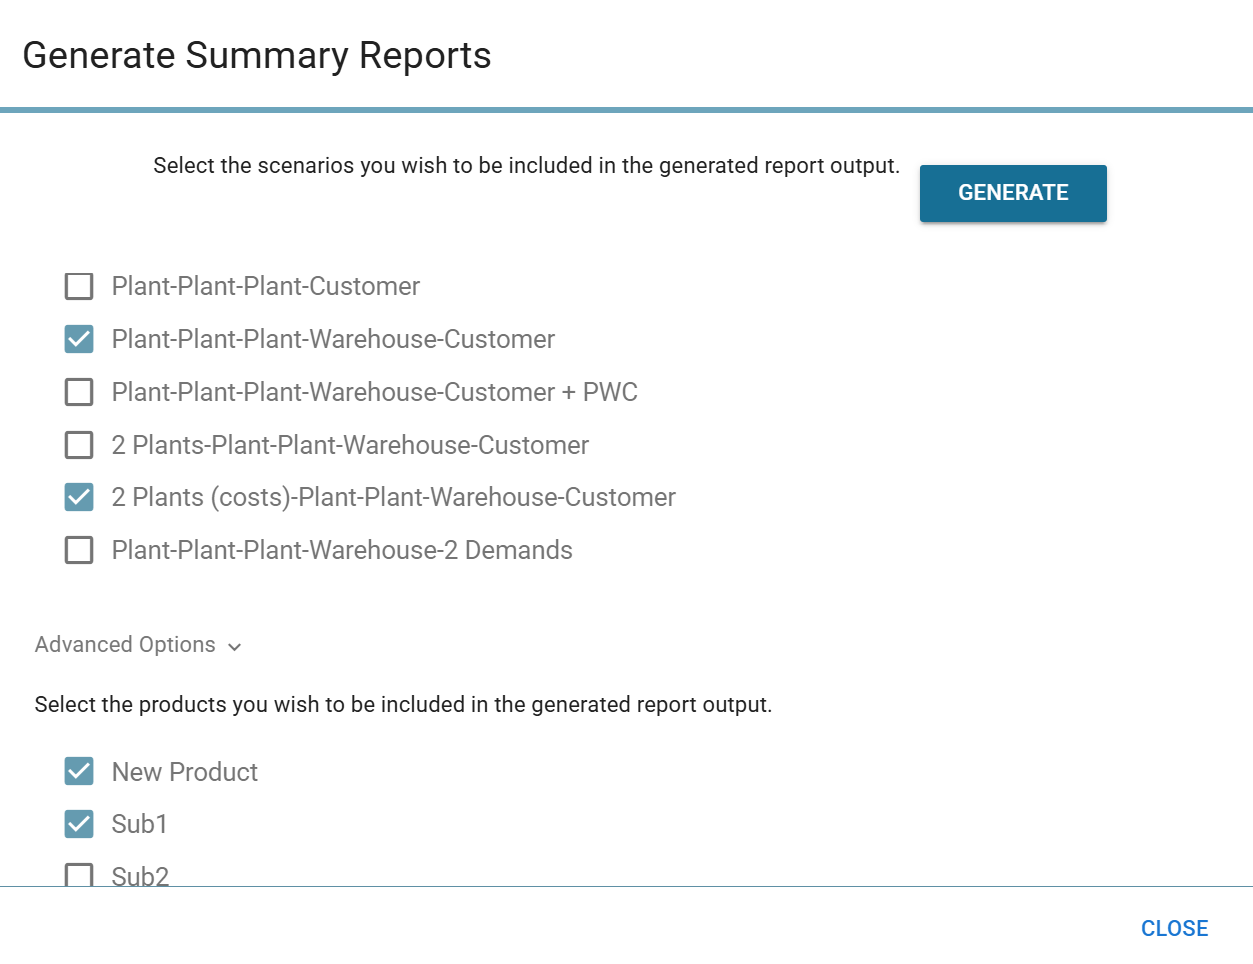
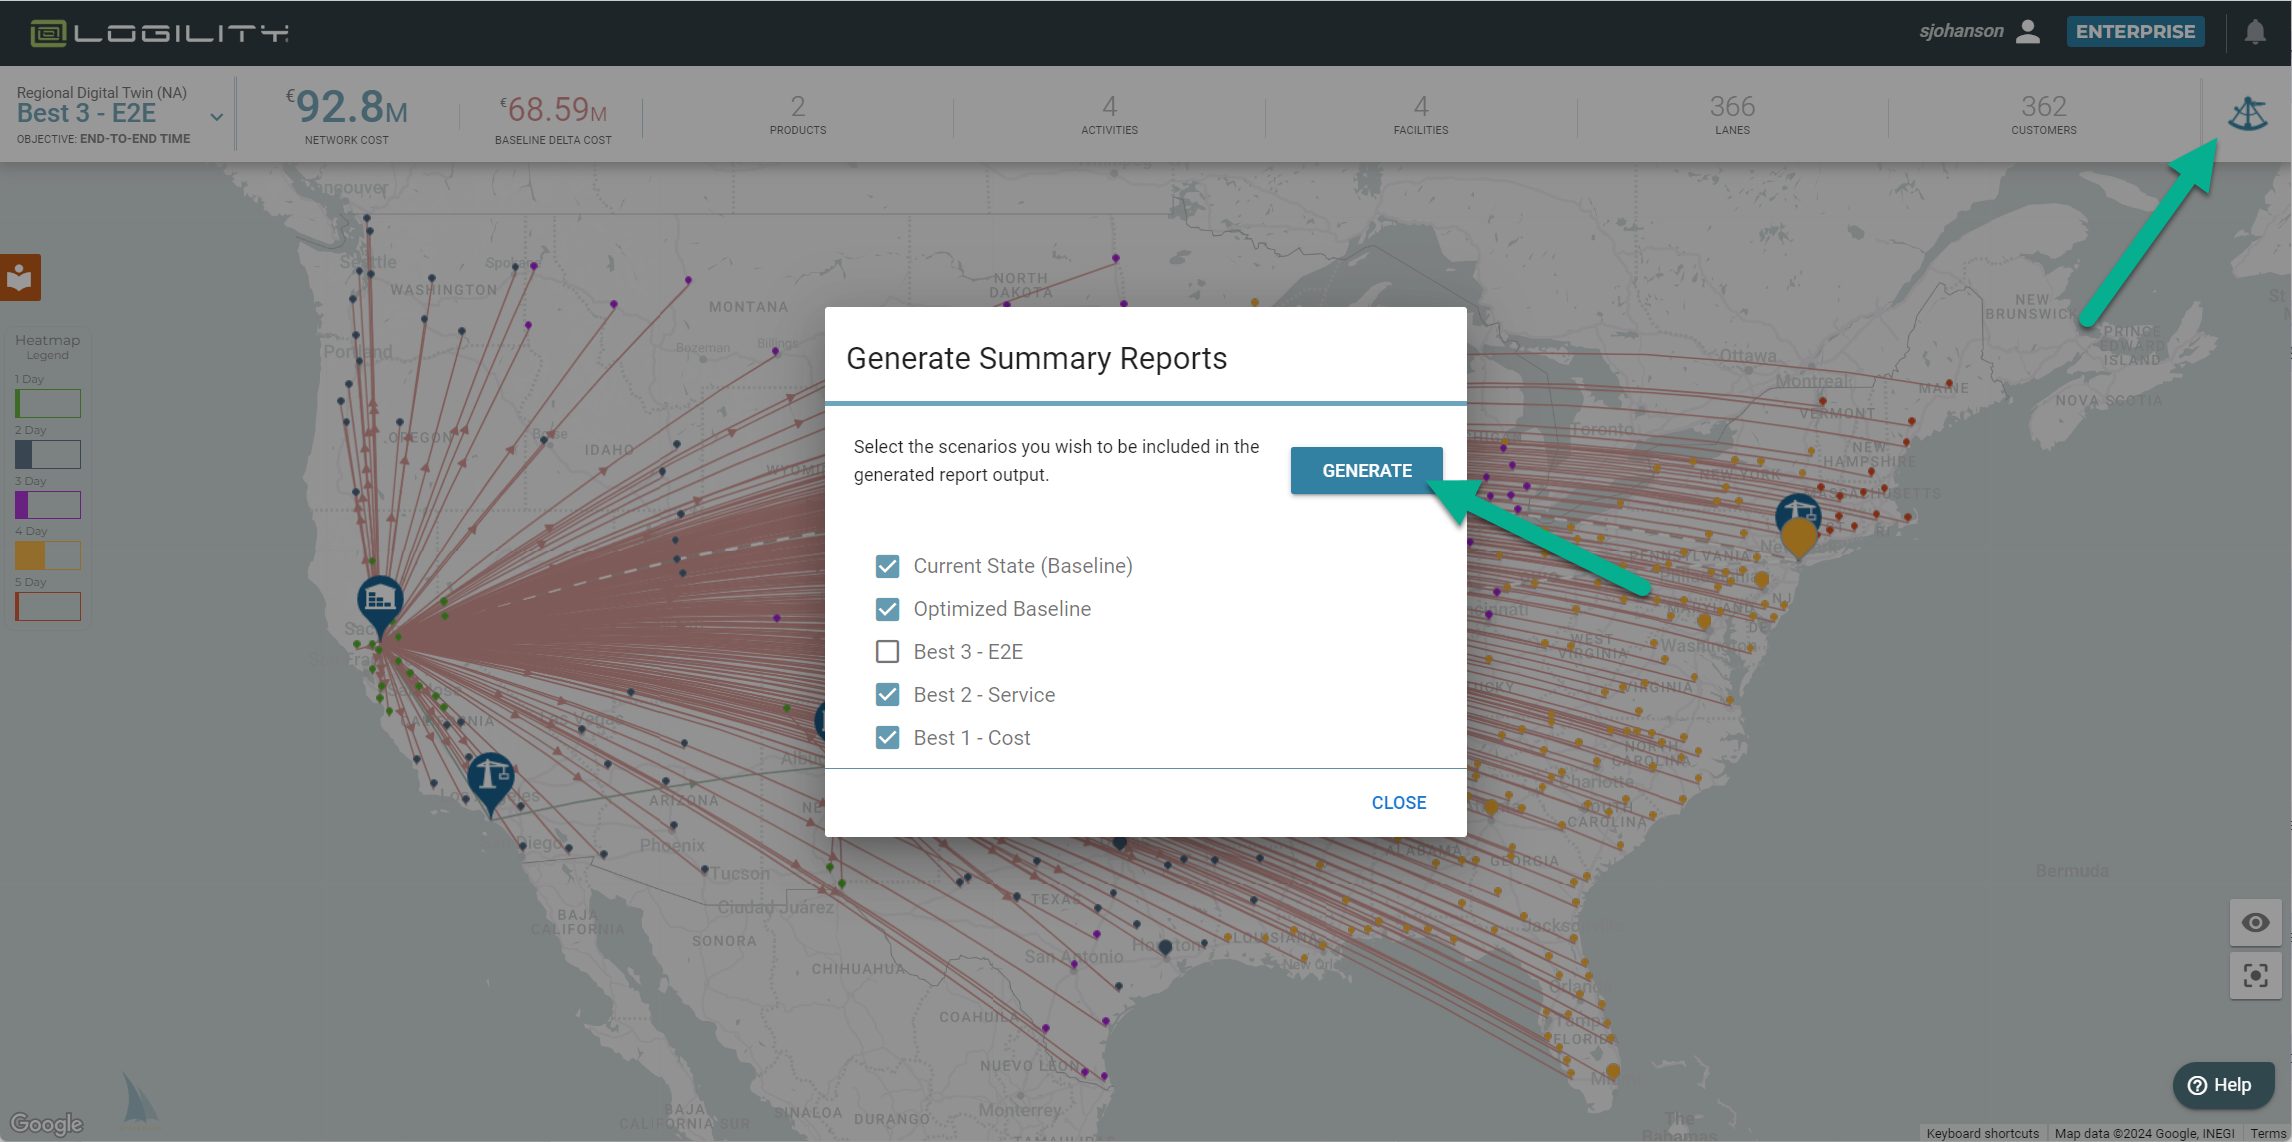
Scenario Comparison Report: Logility is improving the process of understanding the opportunities coming out of the optimization processes. A shortcut for generating a contextualized summary report can now be found helping users compare scenarios for key outcomes on cost and flow.
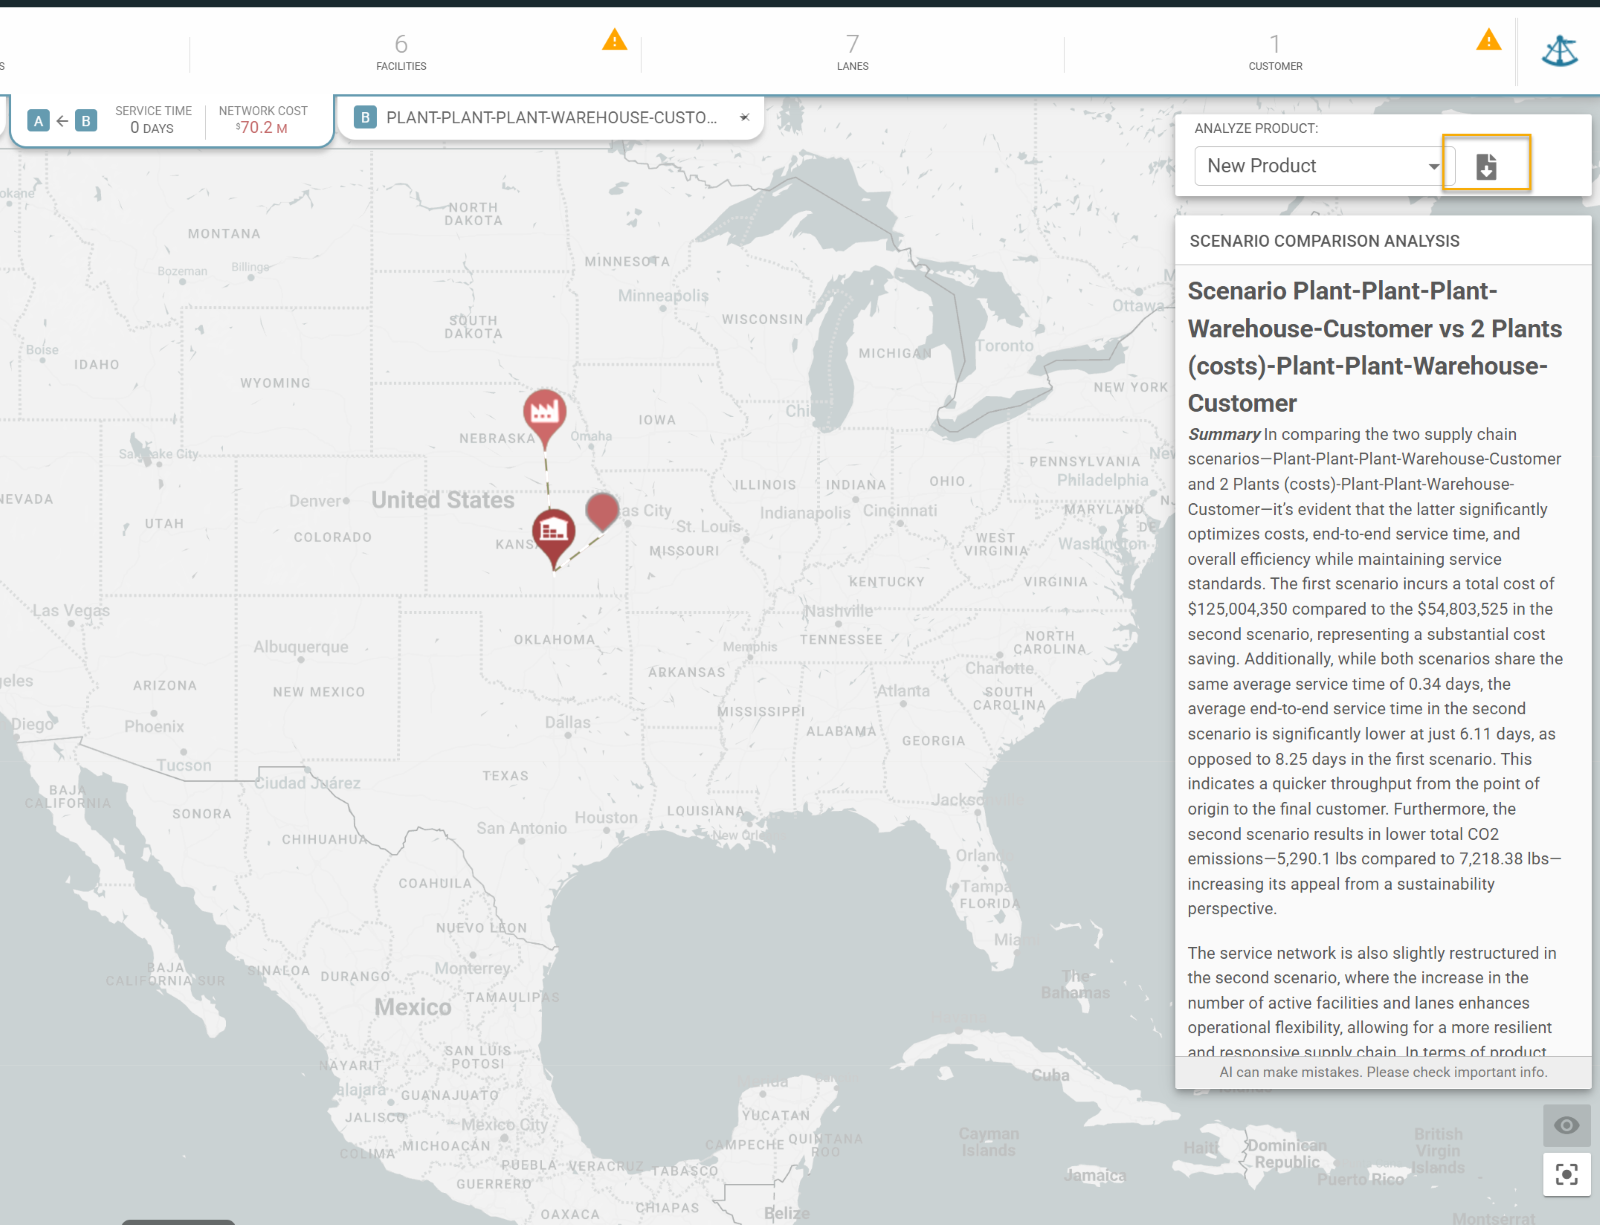
- In the AB comparison view, we have a button in the sidebar to generate a summary report with rows filtered to the A and B scenarios, and the selected comparison product.
-
When generating a summary report, users have the option to choose which products to include in the report.
Release Date: 14 January 2025
Summary
- Scenario Comparison Map
- Gen AI Scenario Comparison Analysis
Here is what you will see:
-
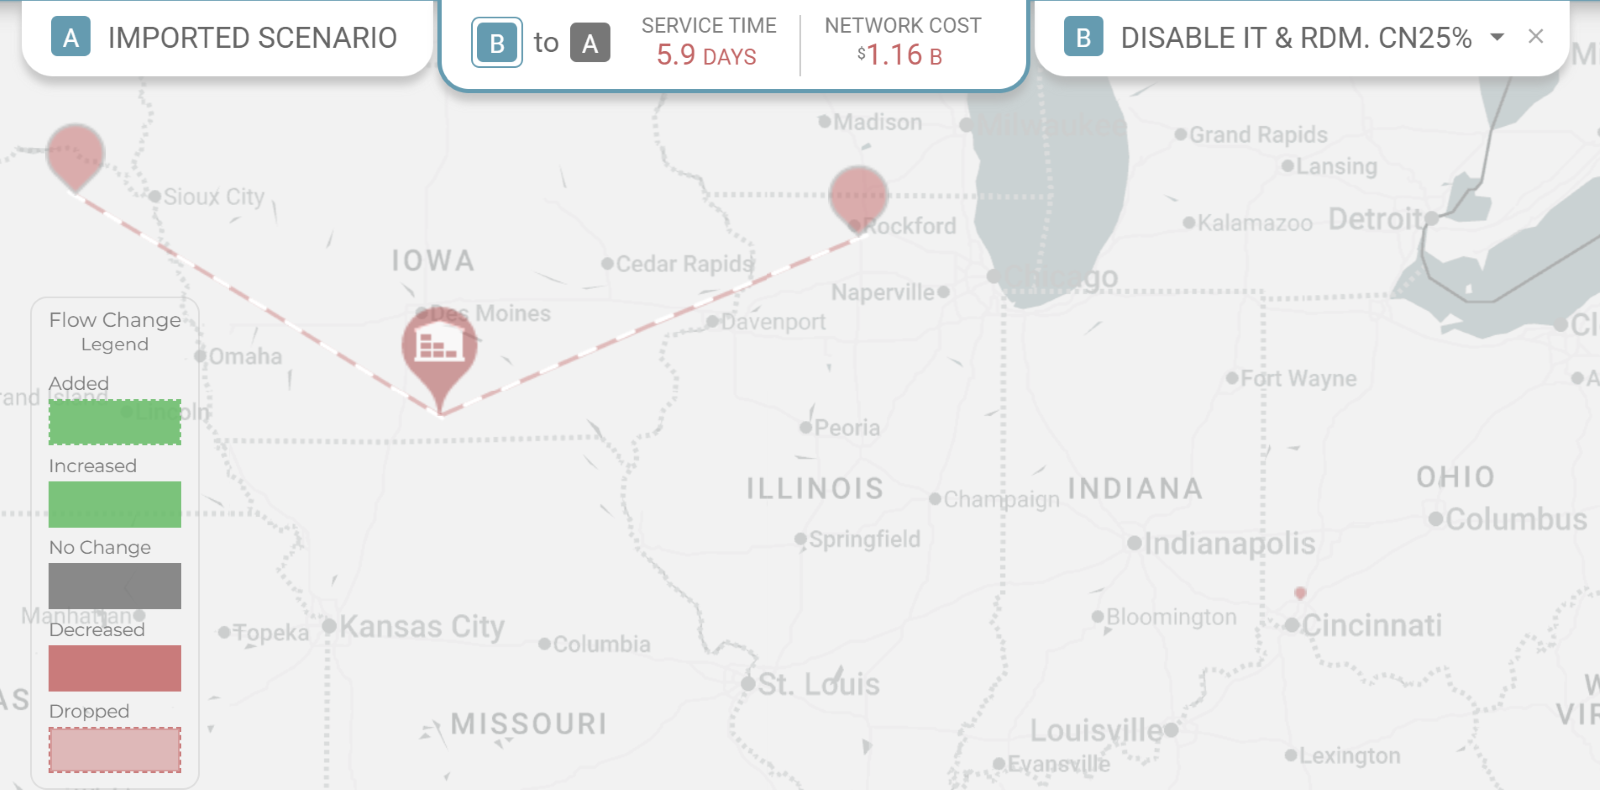
Scenario Comparison Map: Modelers! You are going to really like this. Scenario comparison will be a focus in our ongoing roadmap and this begins with the overlay mode. You will now have the unique capability to select two scenarios and alternatively look at the scenarios and also overlay them to focus on differences.
Try this:
Open a model you are currently working on and duplicate a scenario—I will explain later why scenarios need to be compared to ones that were duplicated from the same original.- Make some changes to track.
-
Click on the Scenario Comparison Button on the north boundary of the map.
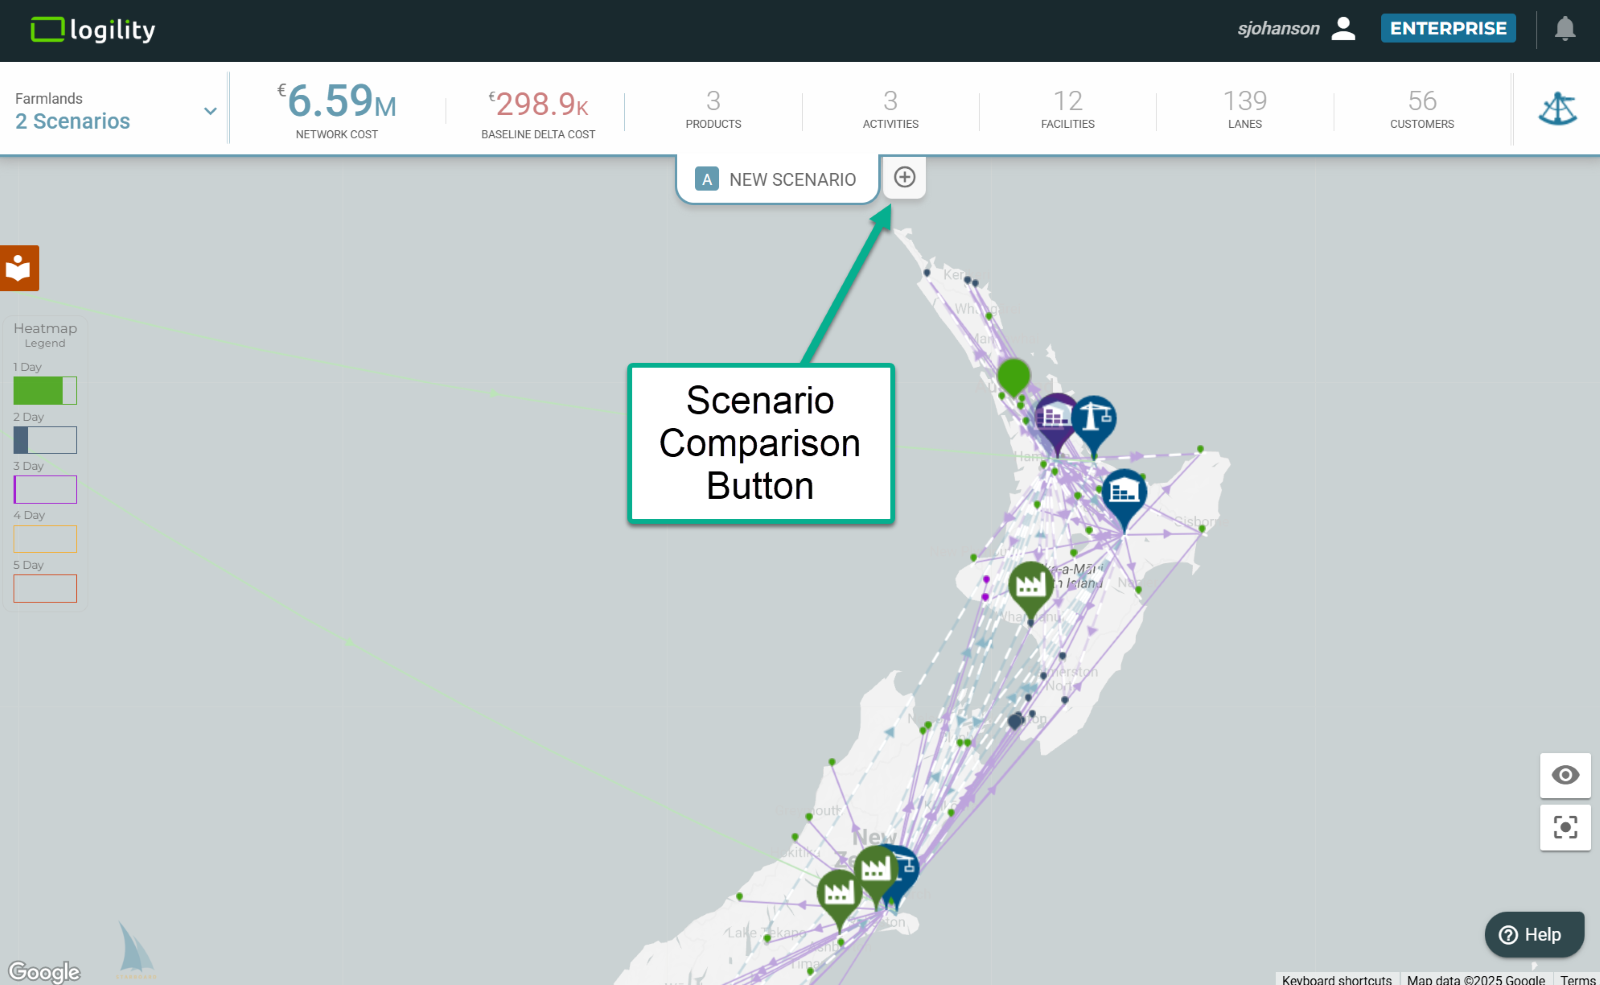 You should see a drop down of your available scenarios.
-
Select the original scenario, or one you know was duplicated from the same original scenario.
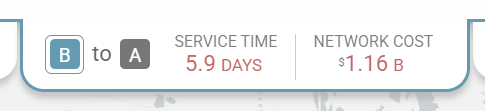
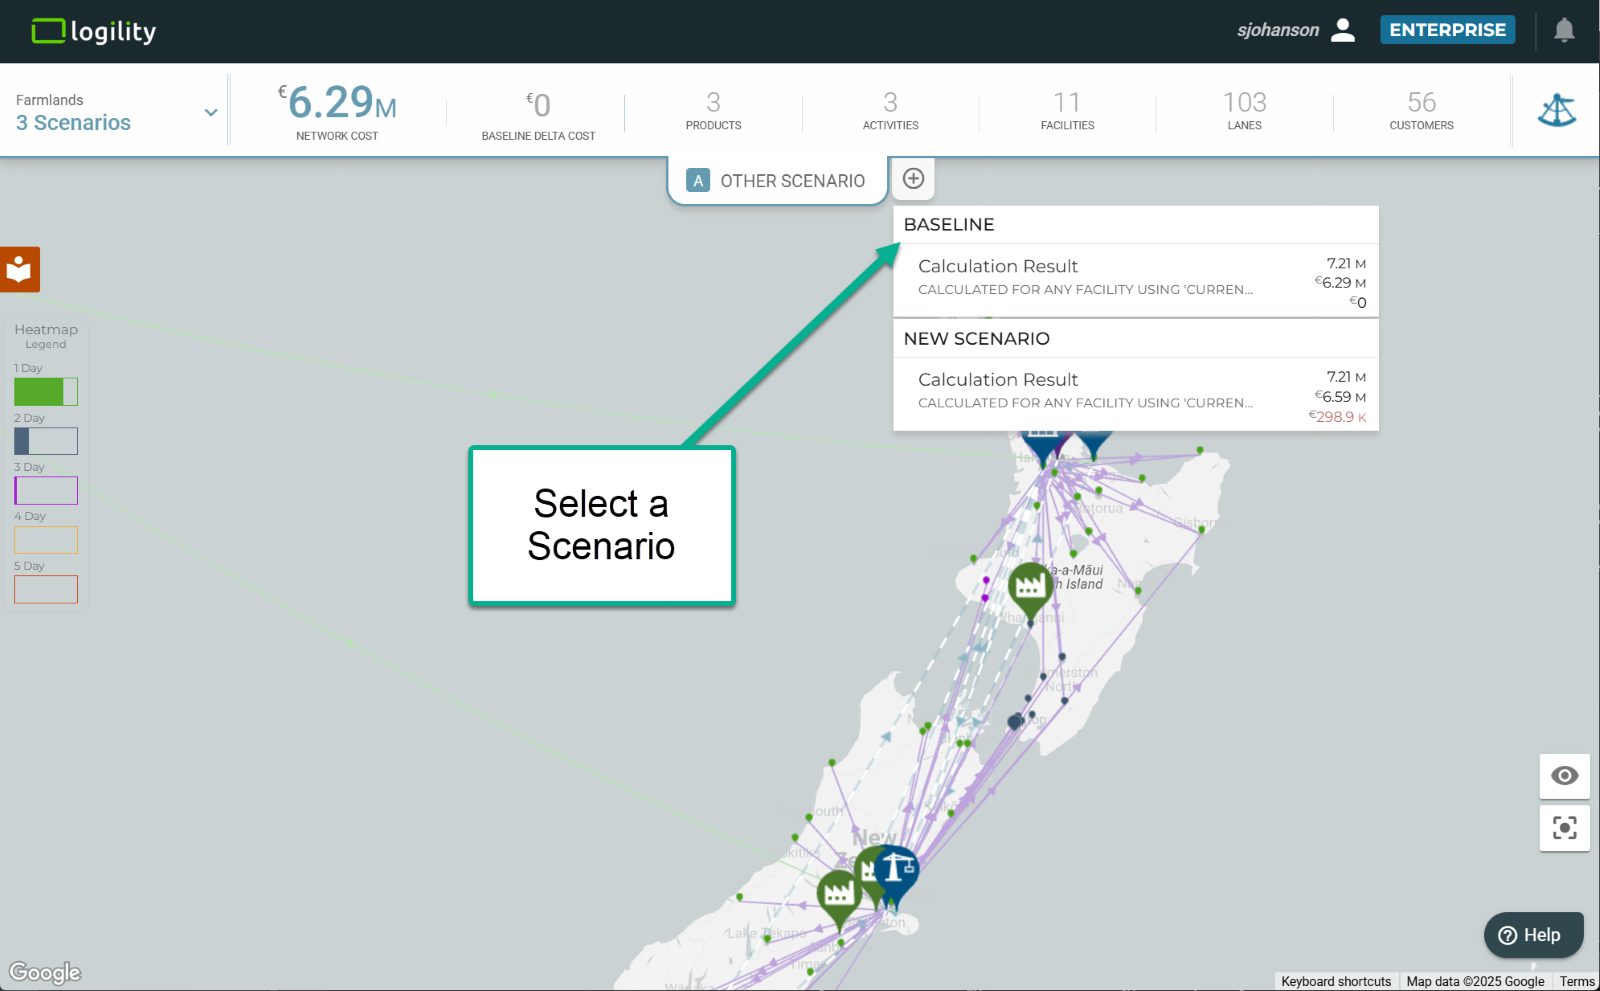 Clicking on each scenario tab will flip flop between the scenarios and also see key metrics in the center tab. Currently these show differences in service and cost. The direction of change is represented by the arrow in the center tab. An arrow from A to B means “how did flow in A change relative to B”. In this example, A has a higher cost than B, the scenario to which it is being compared.
- You can change direction of comparison by clicking on the arrow.
-
Select the center tab so you can enter the comparison map.
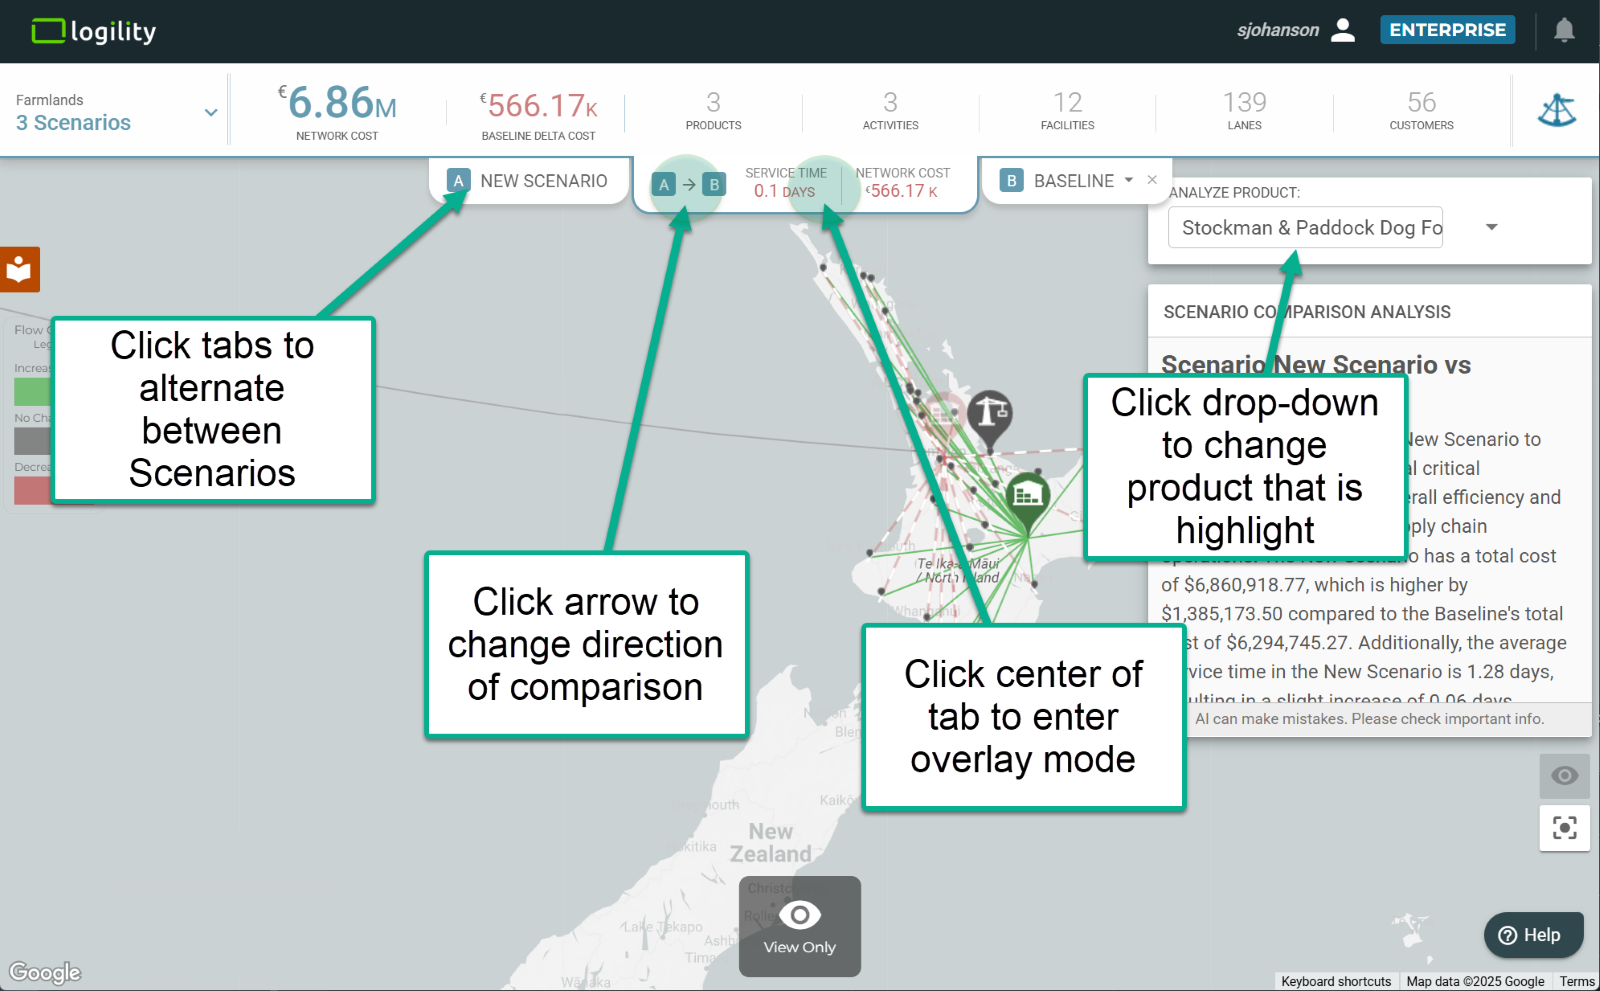 Now the fun begins. If you look closely at the map, it will have highlights for changes.
Green—nodes and lanes that were either added or increased in flow.
Red—nodes and lanes that were either dropped or decreased in flow. Red dashed lines highlight lanes that are not used.
Grey—no change. -
Each network diagram is filtered to a selected product. This can be selected in the “Analyze Product” dropdown in the upper right.
-
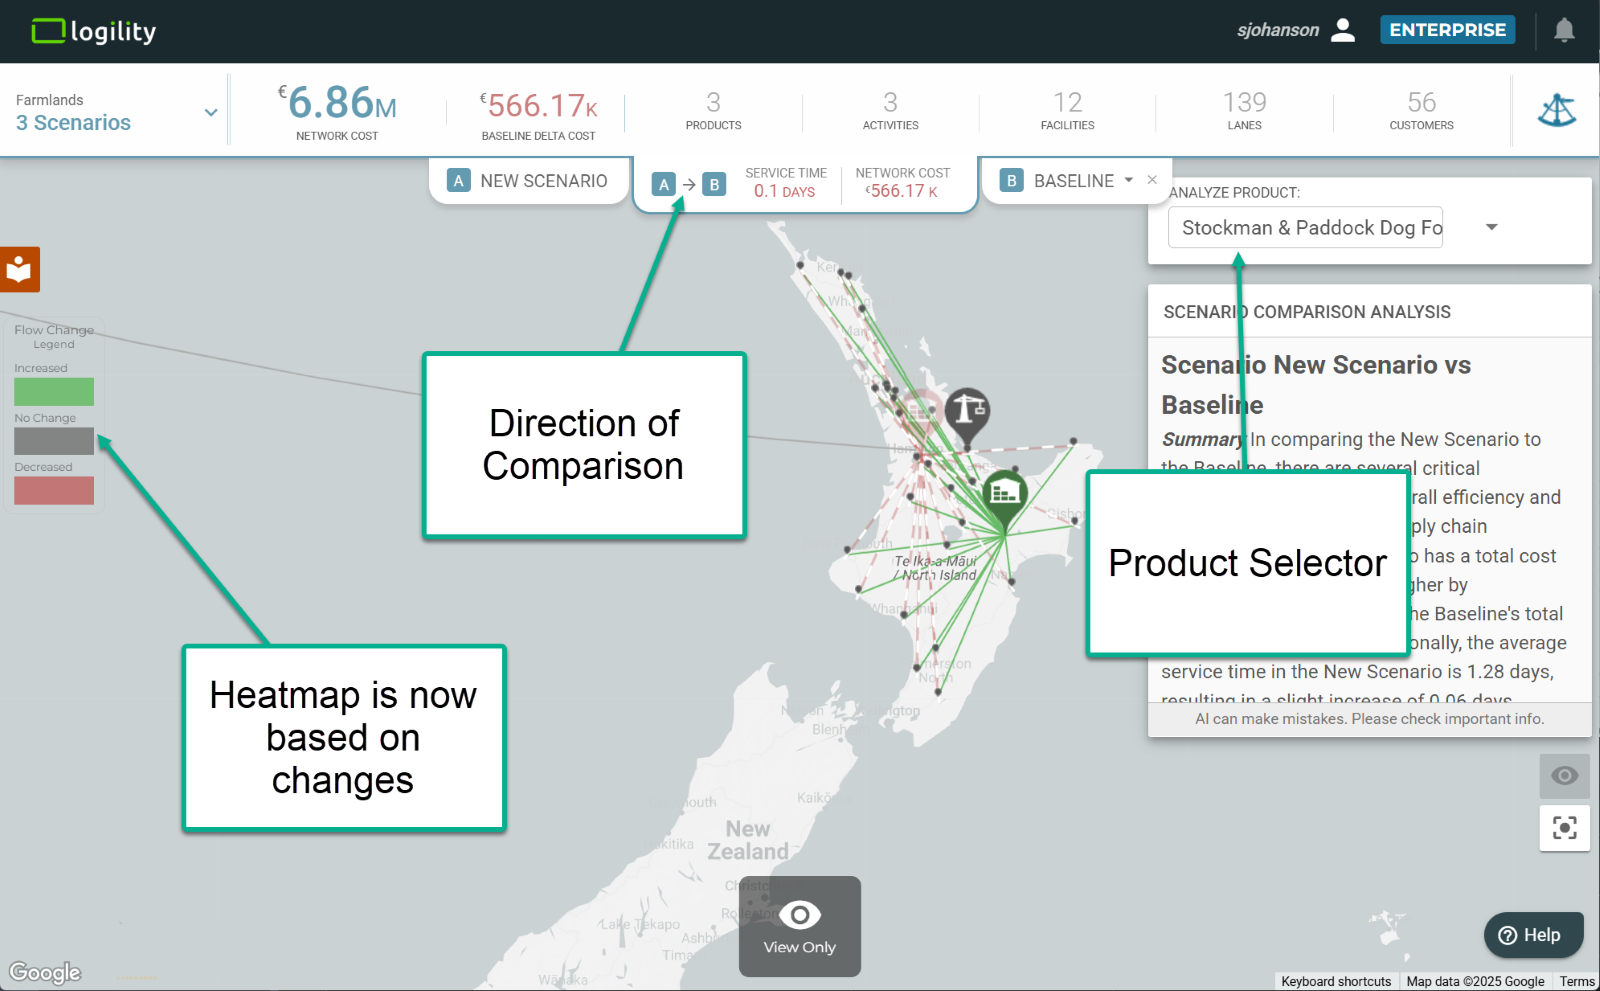
Selecting the legend of the heatmap will allow you to toggle different values on or off to highlight all increases, all decreases, or all objects that remained unchanged.
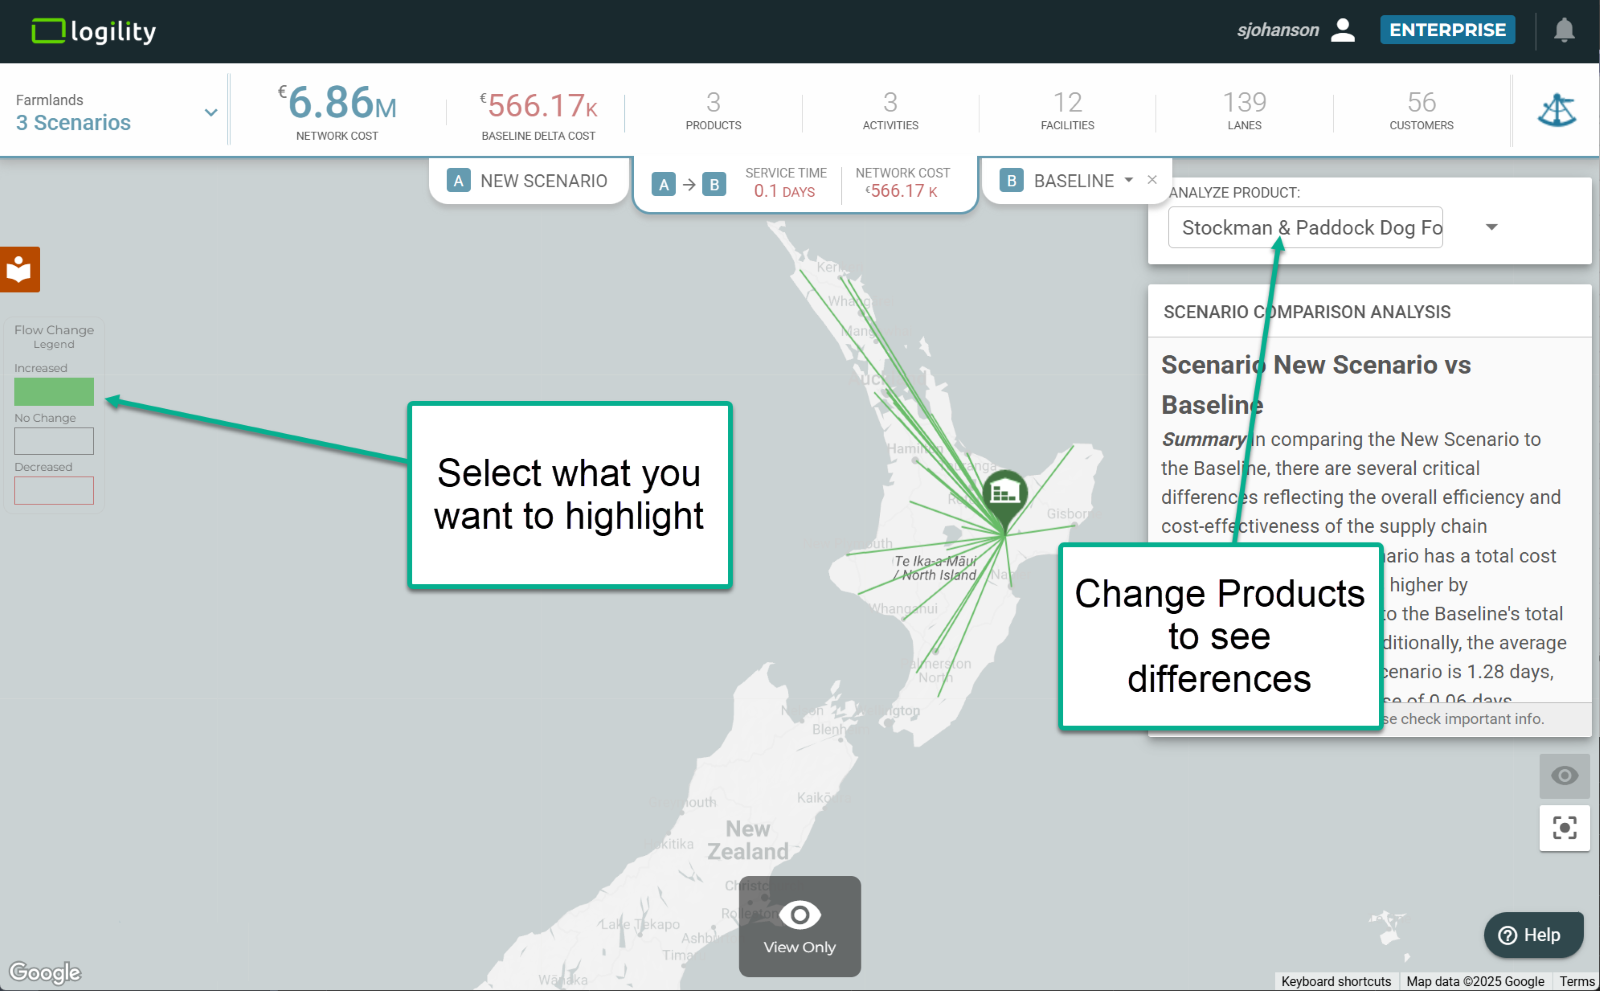
NOTE: Scenarios can be compared if they have been copied from one another. This allows the system to know what nodes are the same from one scenario to the next. This can also be achieved in future scenarios by uploading nodes that are the exact same name, type, lat-long, and country code. There will be legacy models where uploaded or independently created scenarios are not comparable.
-
Gen AI Scenario Comparison Analysis: Here is another great improvement that you will like. When you enter scenario overlay mode, Logility’s Generative AI engine is engaged to analyze the changes. This is an evolving capability as we explore ways to better use Generative AI.
Try this:
Follow the same instructions as above.- Select a model to compare to the currently selected one.
- Click the center of the middle tab to enter Scenario Overlay Mode.
-
Watch the window labeled “Scenario Comparison Analysis.” After a brief generating period, it will pop up a written summary of the changes.
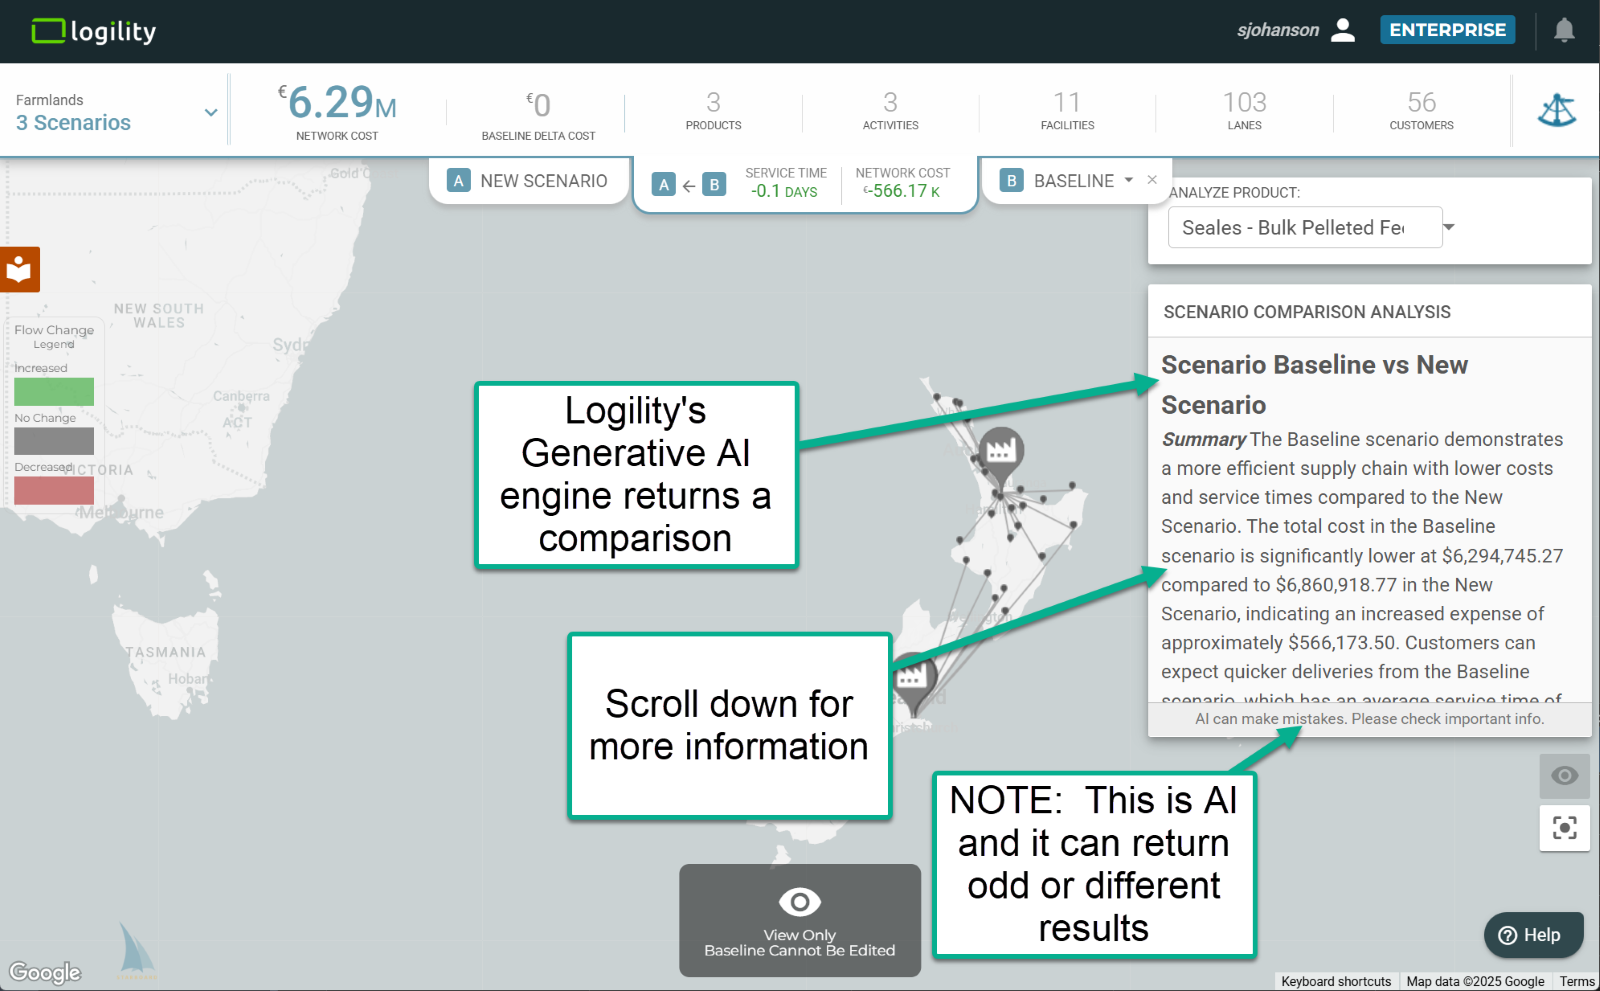
This comparison is sensitive to the direction of the arrow. Also, AI has a certain amount of artistic license. You might see statements that are wrong or odd.
CALL FOR FEEDBACK: Logility sees both the comparison of scenarios in one map and use of Generative AI as areas to focus our development efforts. Please provide your thoughts and feedback by entering a ticket in the user portal.
Release Date: 3 November 2024
***PLEASE READ***
***THIS RELEASE WILL CHANGE THE WAY YOU INTERACT WITH BASELINE SCENARIOS***
Summary
- Updated Scenario Selector
- Baseline Elevation and Locking
Here is what you will see:
-
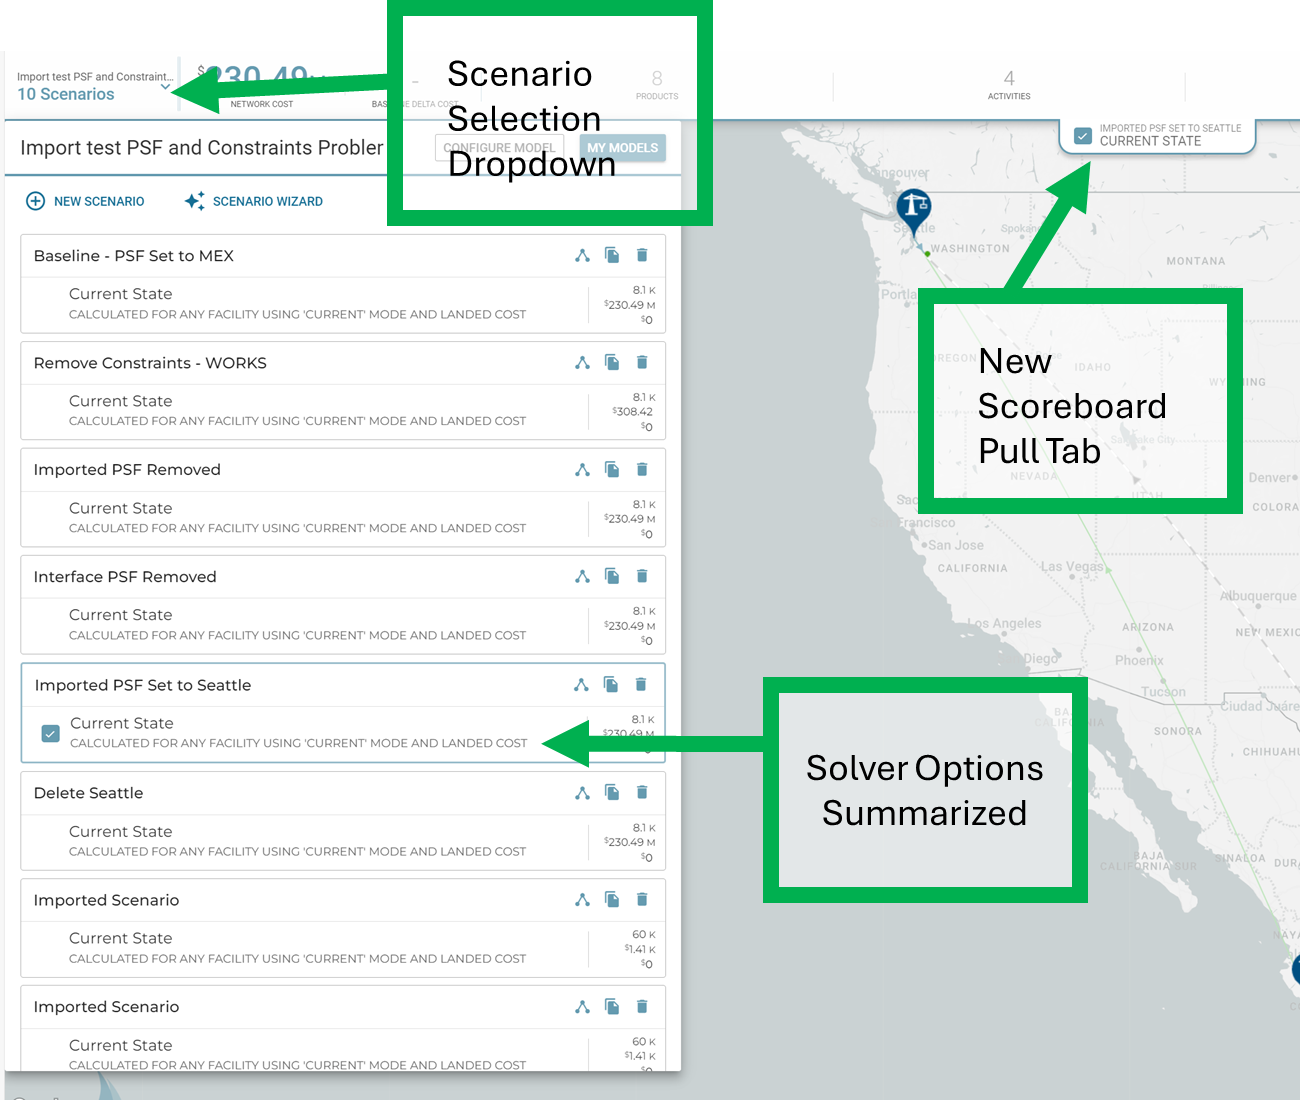
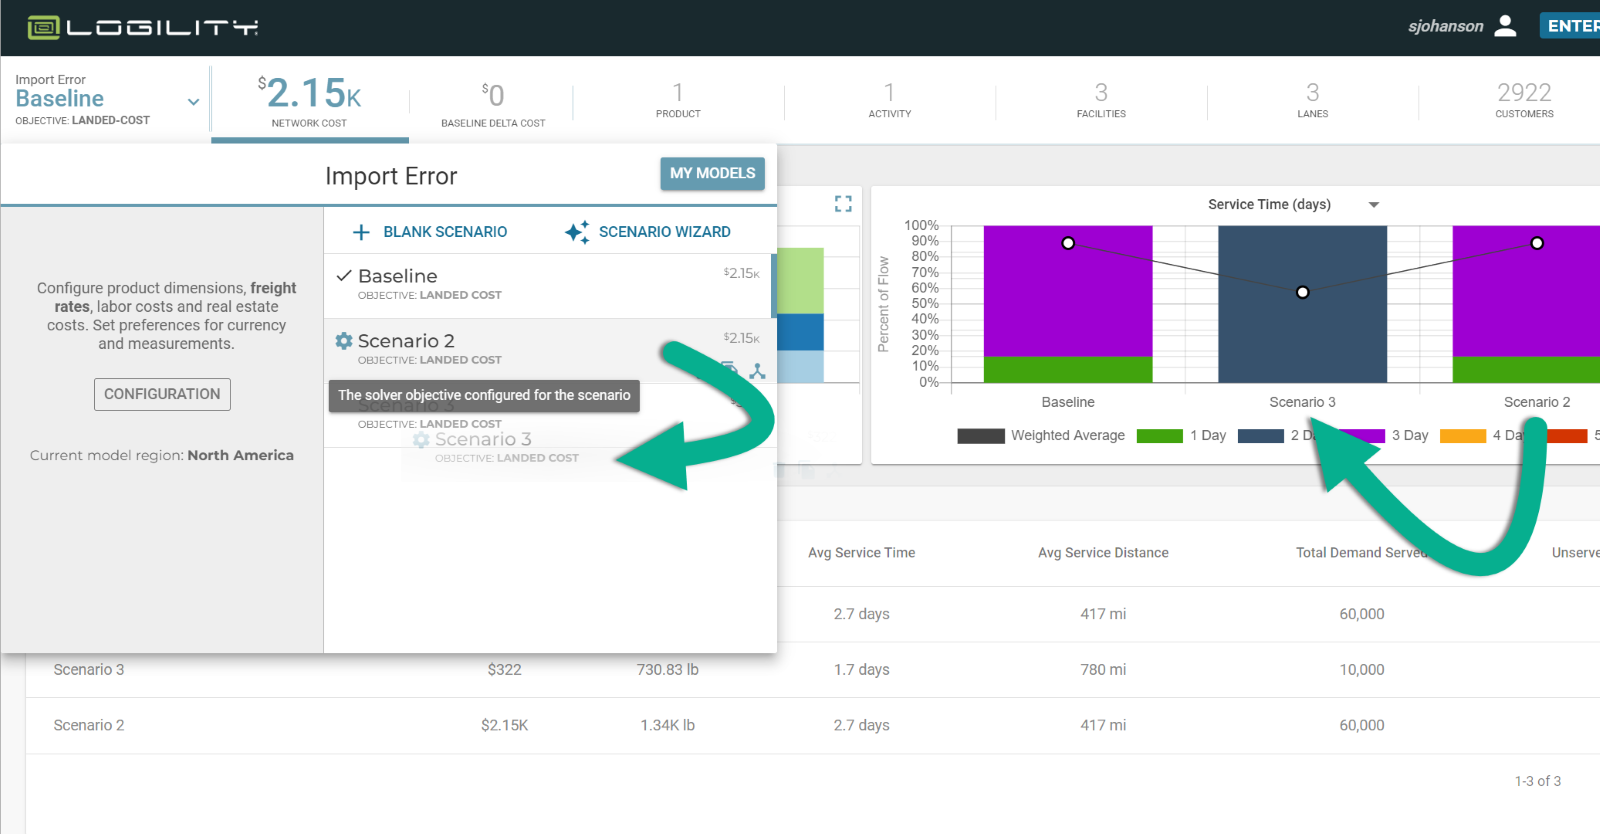
Updated Scenario Selector: The way you interact with scenarios has been improved in this release. The model and scenario metrics have replaced the scenario name previously displayed in the upper left corner. The updated scenario selector now includes details about the solver options utilized to generate specific results, and you can now rename scenarios inline in the selector.
When you select a scenario, its title and calculation result title will be displayed in a new scoreboard pull tab.
-
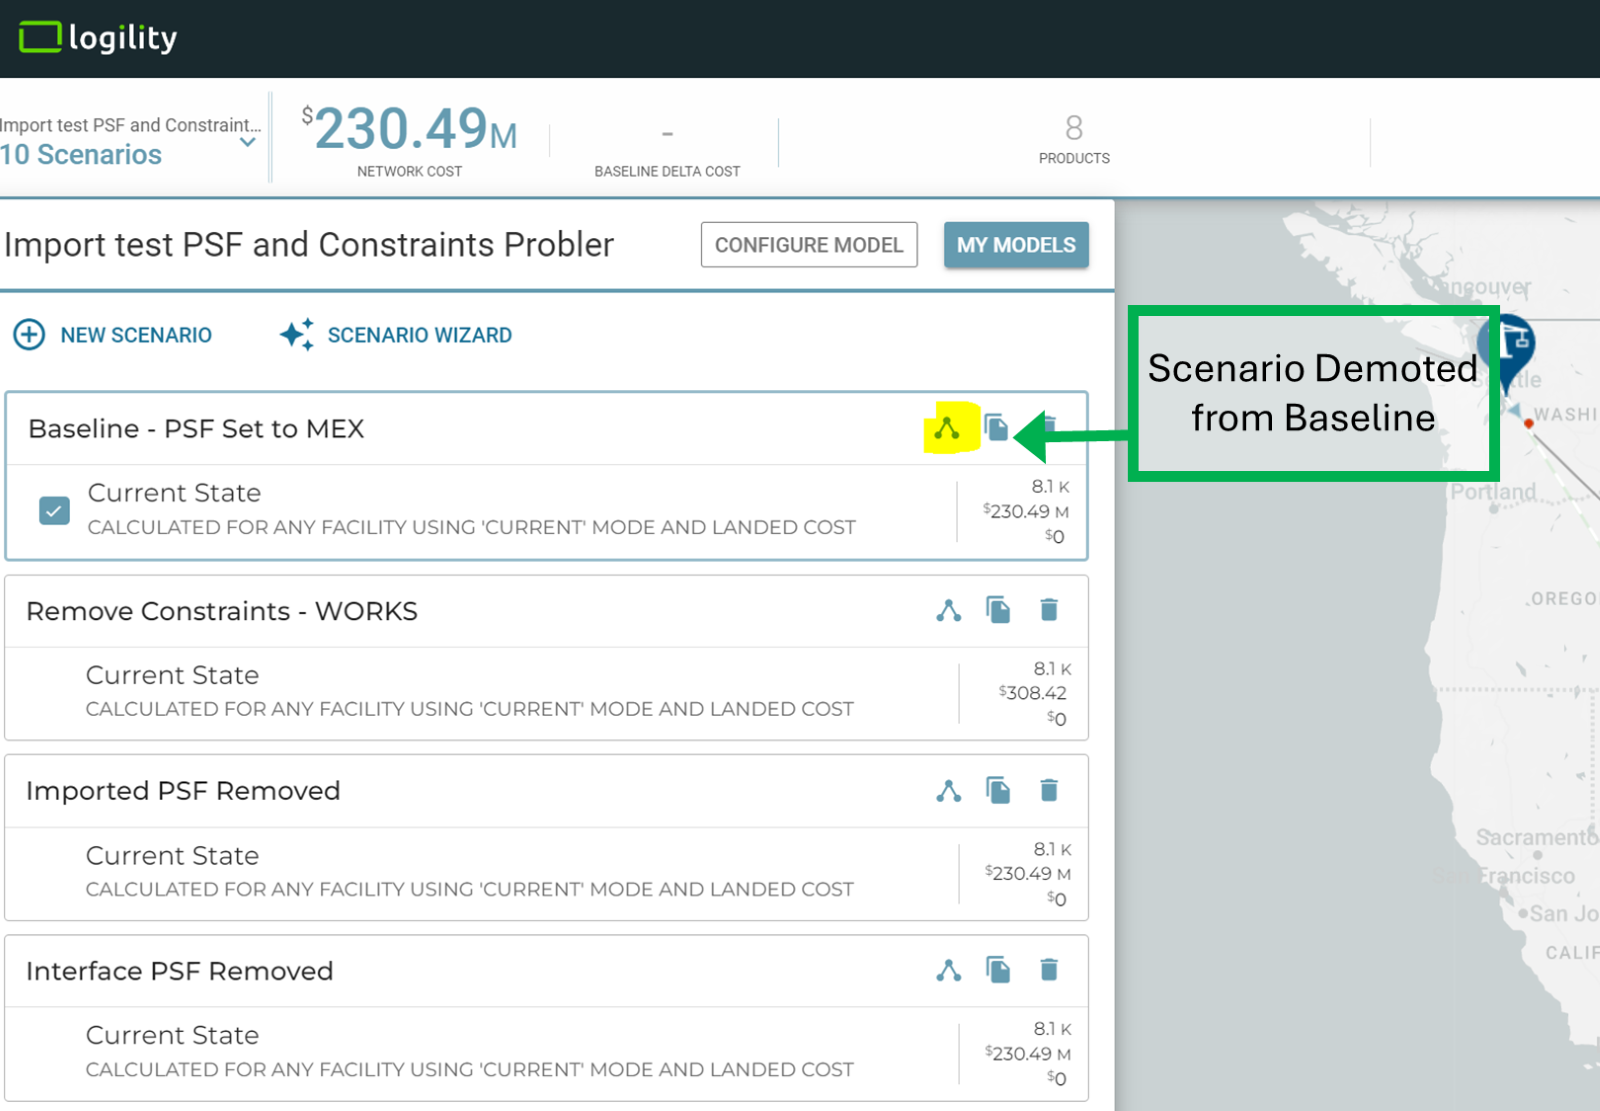
Baseline Elevation and Locking – In preparation for future changes that will support scenario comparison and A.I. analysis, baseline scenarios will have a new behavior. When a modeler designates a scenario as a "Baseline" it will be locked from editing, data will be immutable and it will be raised to the top of the scenario list, with a baseline title.
Here is a scenario that has been set to the baseline: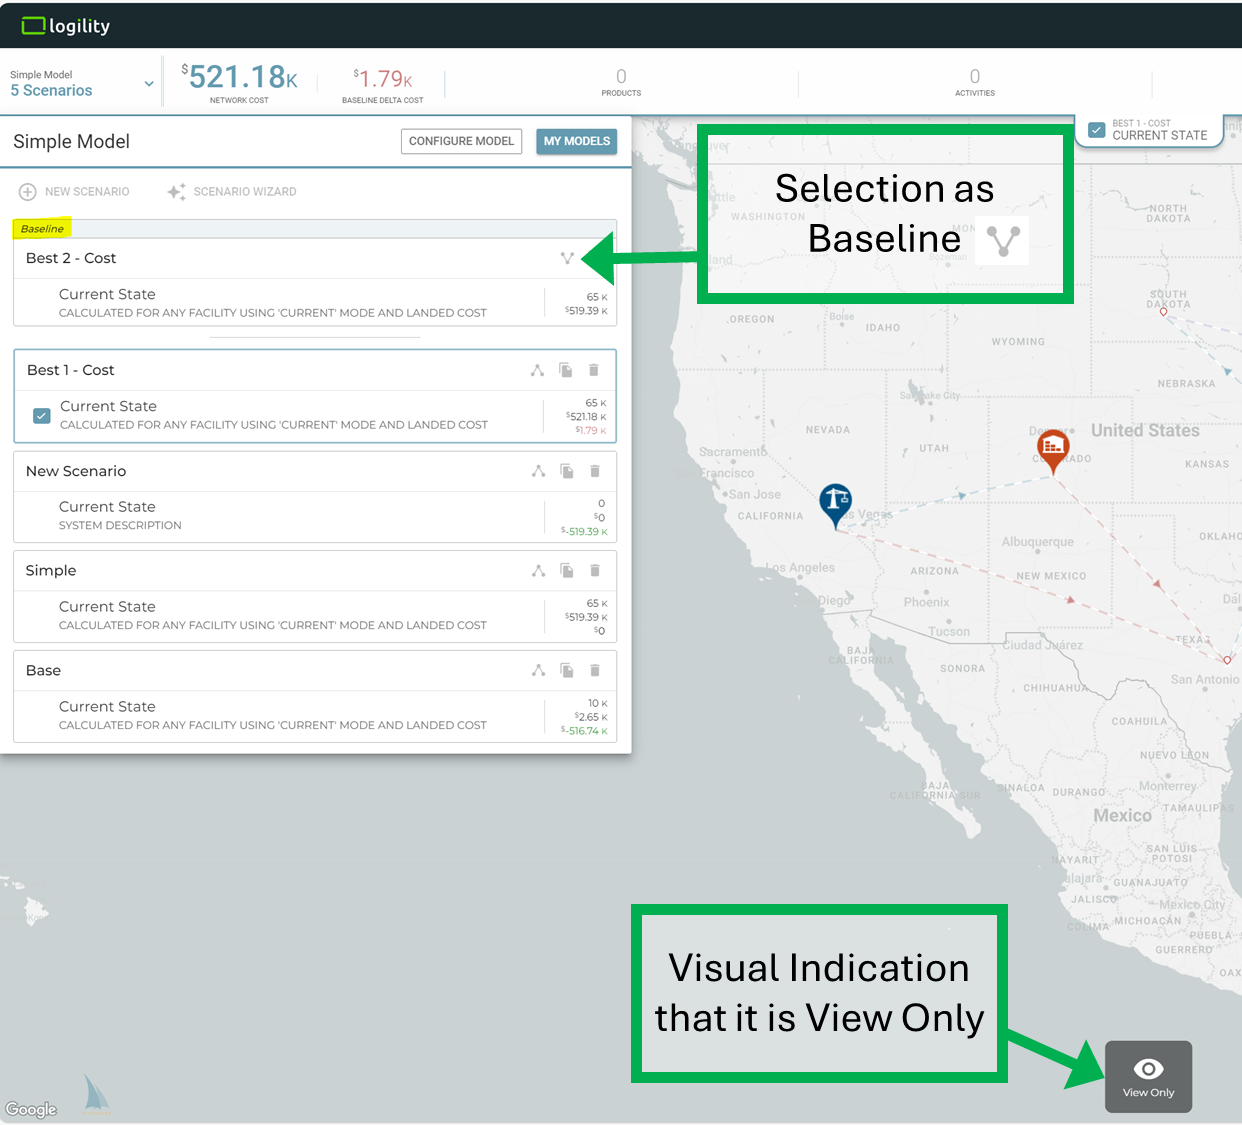
Once a baseline is selected, scenario scoreboard would show the baseline delta cost. This information is also available next to each scenario at the scenario list, together with total flow, network cost, from top to bottom.
And if you wish to demote a scenario from baseline and be able to edit it, just flip the baseline icon.
Release Date: 8 September 2024
Summary
- Scenario Reordering
Here is what you will see:
-
Scenario Reordering: If you thought searching the model library was exciting. Try this:
- Open your scenario selector
- Click and drag a scenario to a new place in the order of scenarios
- See that the order of scenarios changes
You can do this to better tell your story. The selector order will also be repeated on the scoreboard and other reports.
Release Date: 25 August 2024
Summary
- Enhanced model management and sharing
Here is what you will see:
-
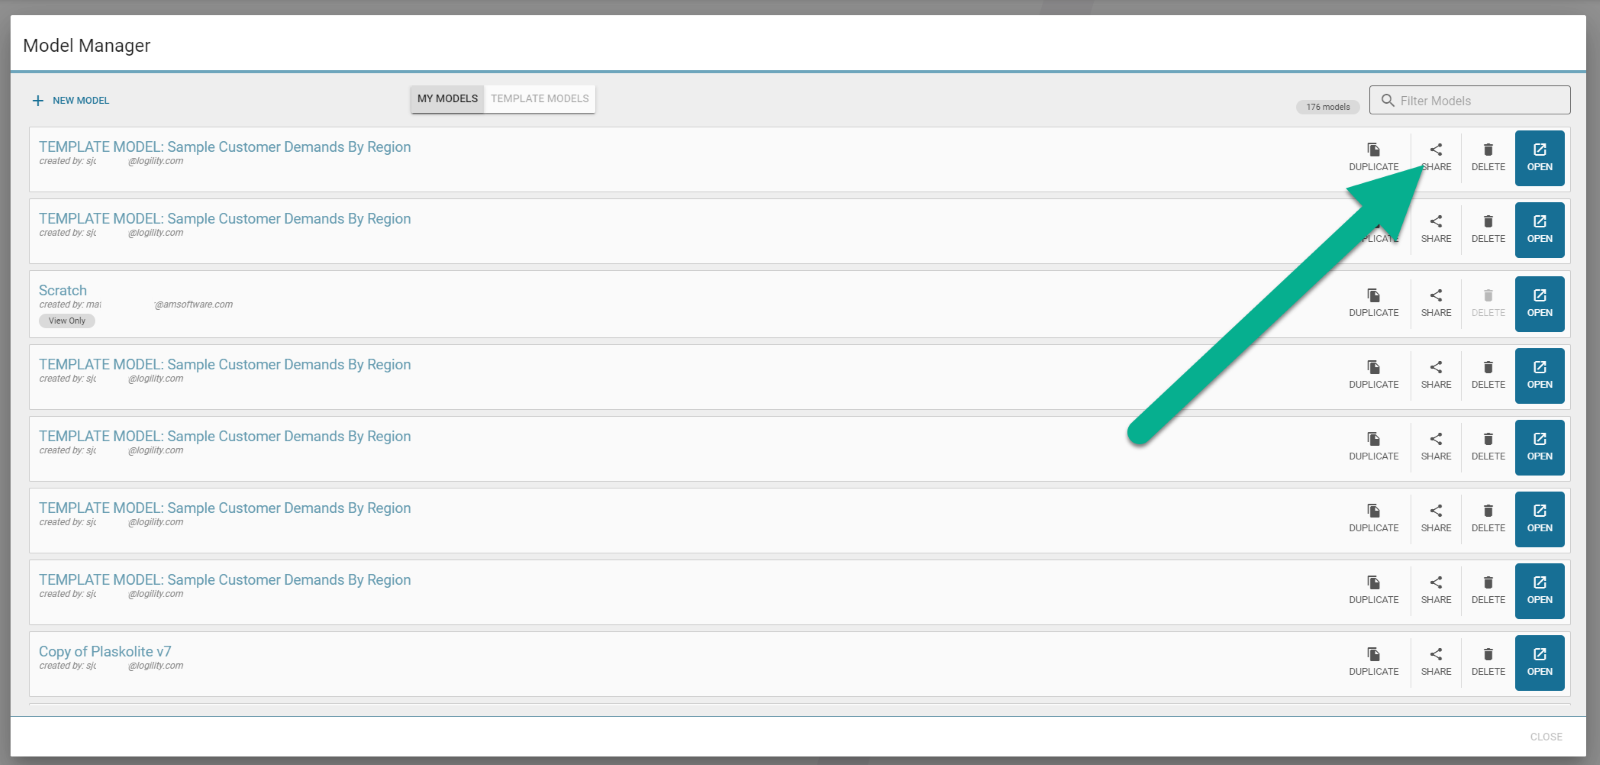
Enhanced Model Management: The model library (scenario selector>>my models) has a new look. When users enter the model library, the open button will be clearer and will be able to open one of any models, with fewer clicks.
-
Sharing for Organizations: The button for sharing will expand. For all users, they can share (duplicate) files to another user as well as generate a private link for view only models. For organizations that have been set up, there are enhanced sharing features. Modelers can collaborate with colleagues by assigning a model as:
- View Only—the colleague can view a model and its scenarios, but will not be able to modify any content.
- Edit—the colleague may make changes to the model configuration and scenario content as well as duplicate and add scenarios.
- Full Access—the colleague can make any changes the model owner can. This includes renaming and deleting.
- No Access—the colleague will not have any access to the model and the model will not show up in the users model library.
When options 1, 2, or 3 are set for a user ID, that user will be able to see the model appear in their model library with specific access levels.
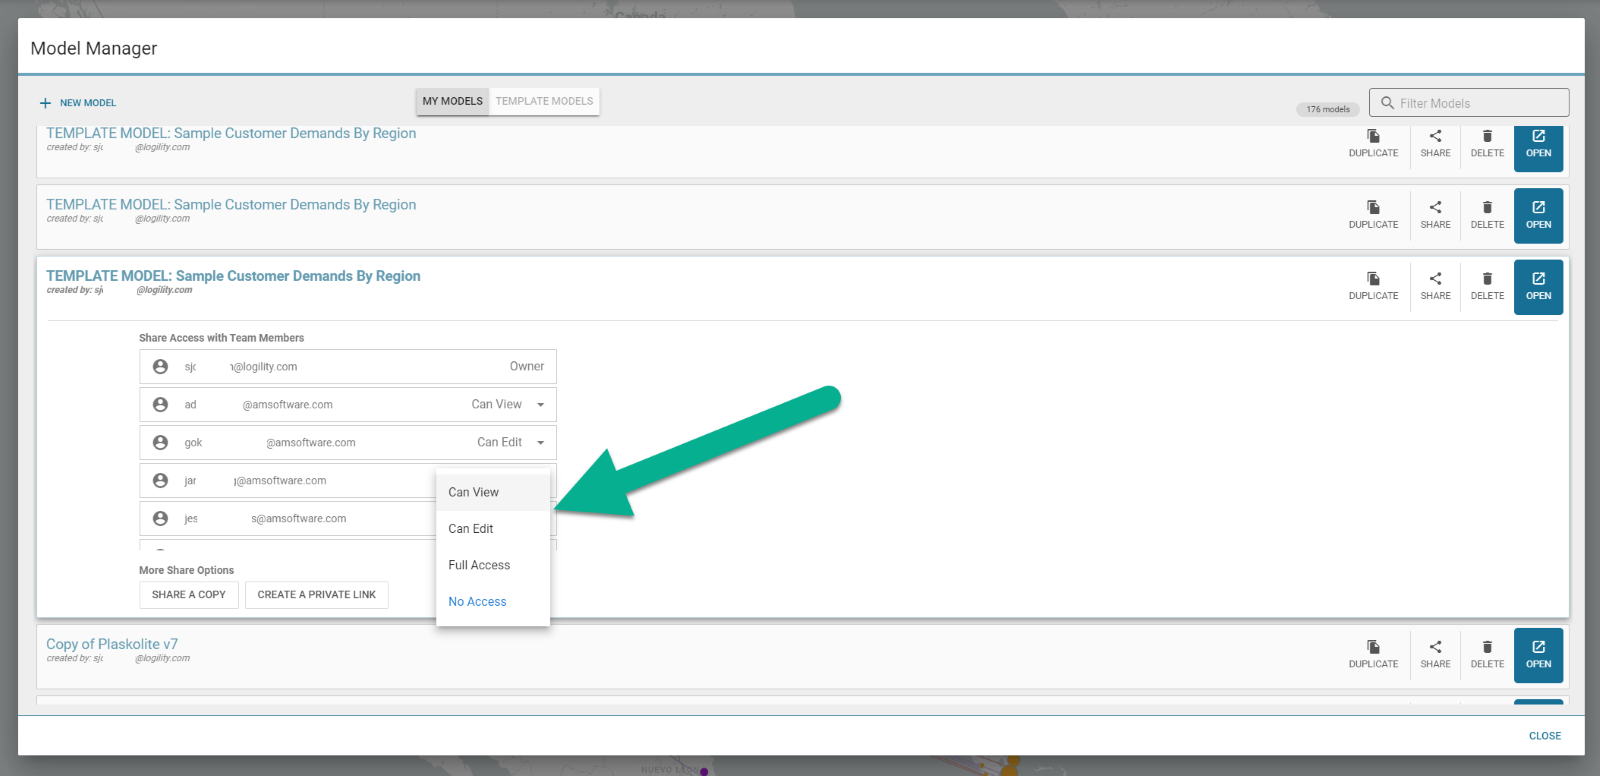
NOTE OF WARNING: Granting another model edit and full access will allow them to make material changes to the model you are working on.
-
Concurrent Use and Locking: When multiple users are in the same model, the scenario that each is working on is locked. This lock is indicated by a lock icon in the scenario selector. Hovering over the lock icon will show who has edit rights over the locked scenario.
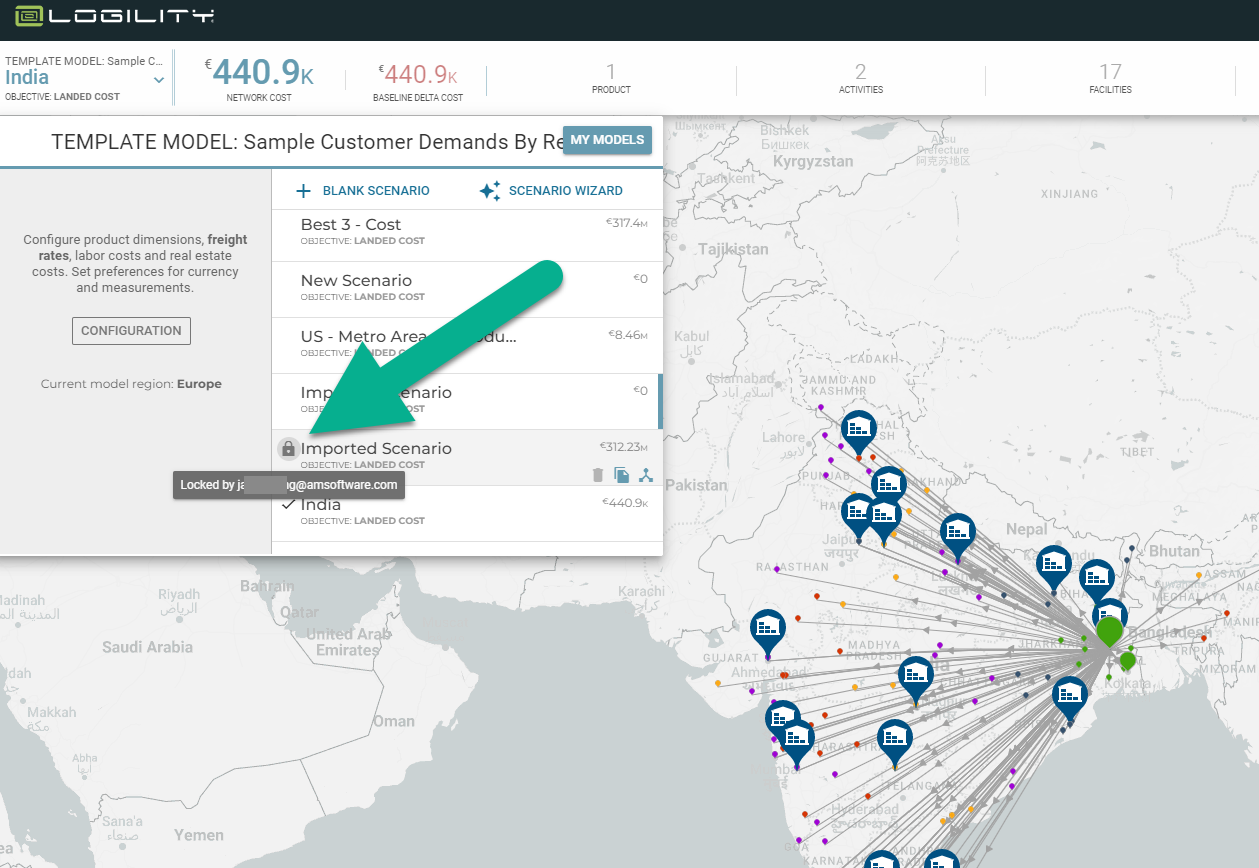
Users opening the same scenario while the lock is acquired will see a watermark showing the user name holding the lock. The passive lock is released when user opens a different scenario. When a user opens a scenario that already has a passive lock, they are automatically placed in a "read only" state.
Model Settings and scenario locks will be released when:
- The locking user opens a different model/scenario
- Ends a session
- Logs out
- Has no activity for a defined amount of time
Release Date: 23 June 2024
Summary
- Geographic "Smart Aggregation"
Here is what you will see:
-
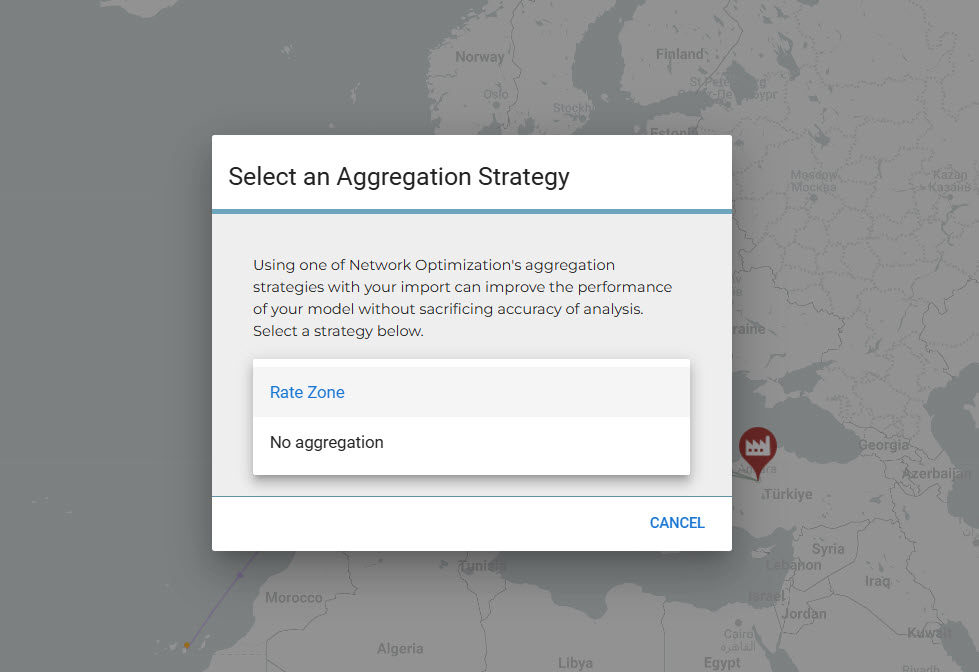
Geographic Smart Aggregation: Logility NDO allows users to automatically aggregate customer nodes based on freight logic. Upon uploading a scenario, users are asked if they want to aggregate by rate zone or to have no aggregation at all. A rate zone is Logility’s geographic designation for a region that has similar freight characteristics. If you chose to aggregate by rate zone, all customers that have postal codes within each zone, will be summed together and represented as one node. This makes all solves run faster and keeps the network integrity by being “smart” about how nodes are combined. Choosing no aggregation will load up each customer node as it is defined in the node table.
Release Date: 17 March 2024
Summary
- Dynamic Inventory Modeling
Here is what you will see:
-
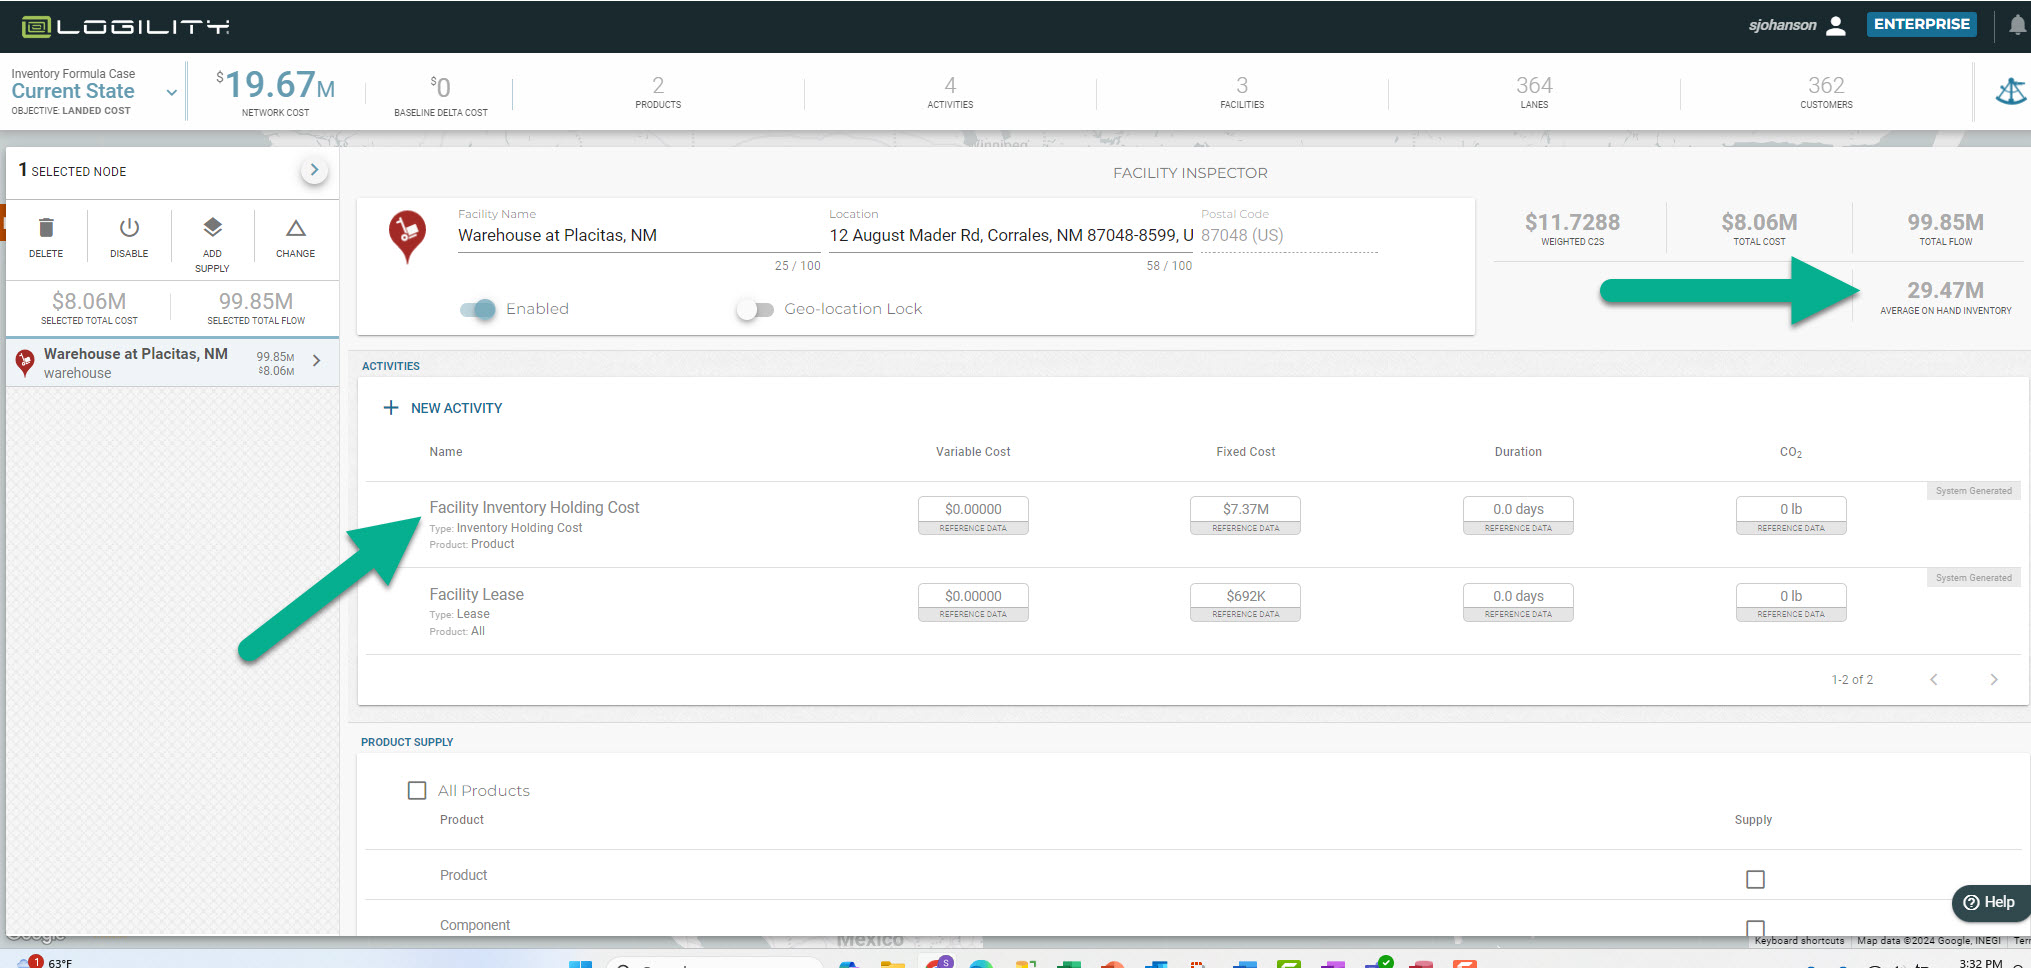
Dynamic Inventory Modeling: Logility Network Optimization can now simultaneously solve to the best network and calculate inventory levels. This new feature will allow modelers to choose to calculate inventory and input model and product level parameters to define inputs to safety stock, cycle stock, and transportation stock quantities. The solver function will use this to optimize a scenario including inventory costs, space constraints, and distribution complexity.
Get started by going to configuration>>inventory and review the input parameters.
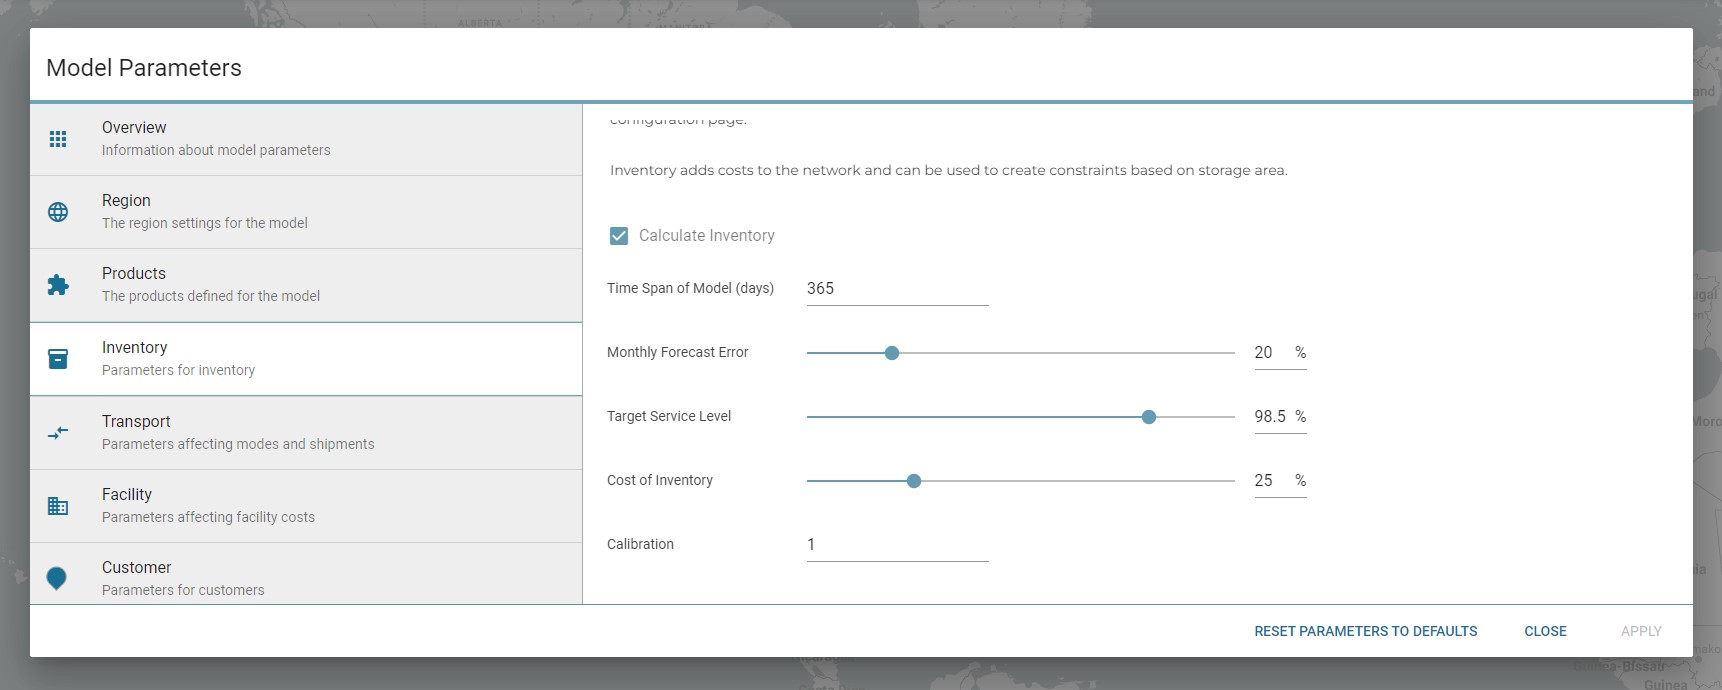
When inventory is activated on this page, a set of product parameters will become enabled also.
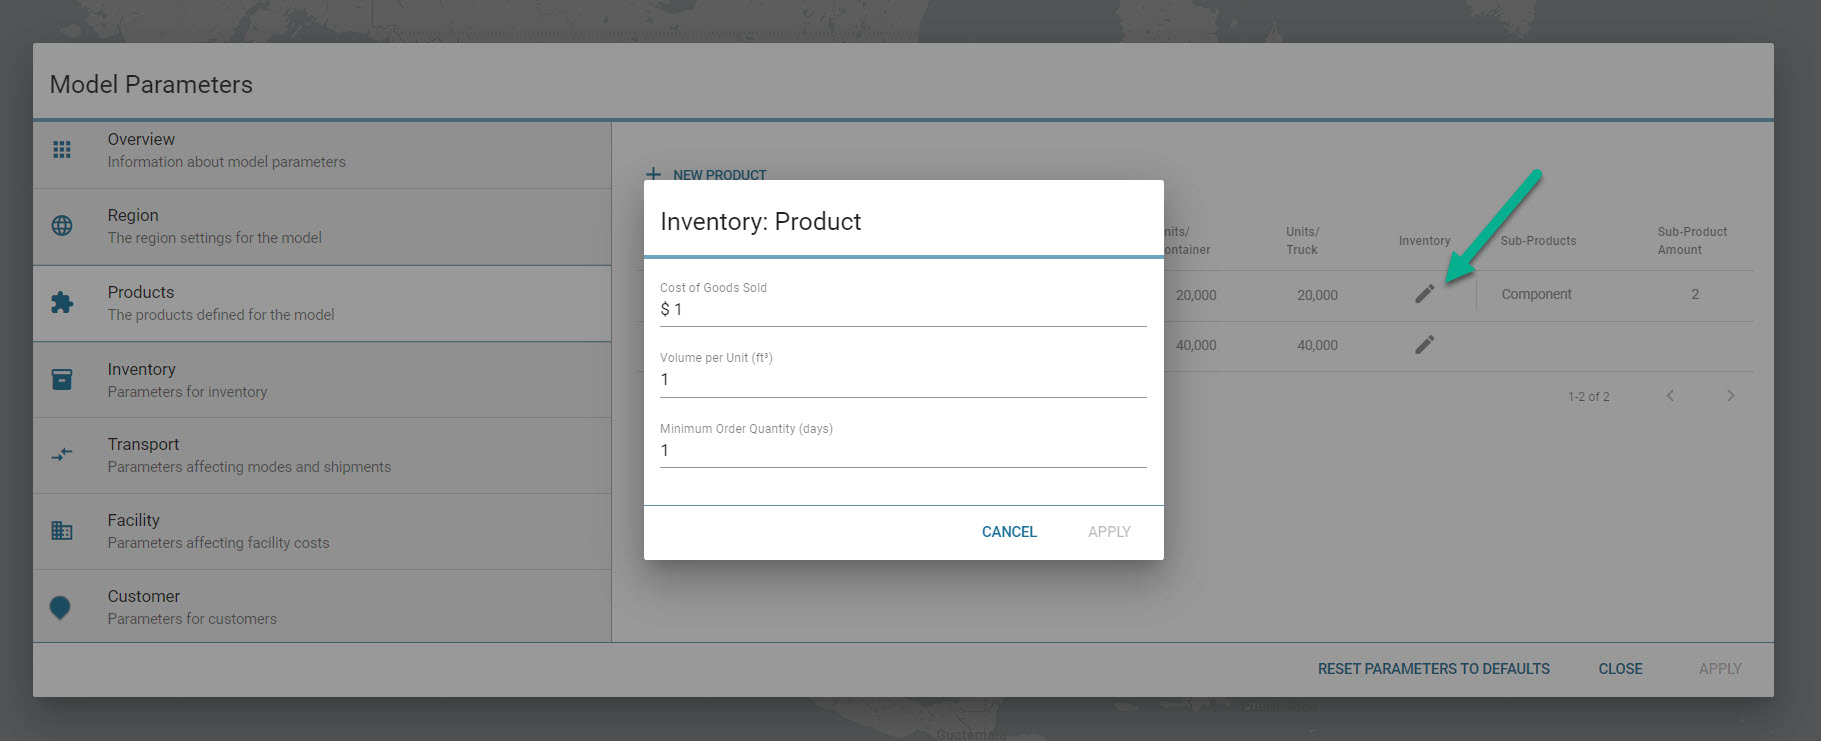
When these parameters are activated, an inventory quantity will be generated at each service facility and this in turn can be used to determine capacity limits and inventory holding costs.
This feature has a complex interaction by which is calculates safety stock, cycle stock, and transportation stock. This playbook explains in greater detail how to use this feature: Playbook: Dynamic Inventory Modeling
Release Date: 18 February 2024
Summary
- Preferred service facility designation for accurate baseline creation
- Accelerated scenario duplication
Here is what you will see:
-
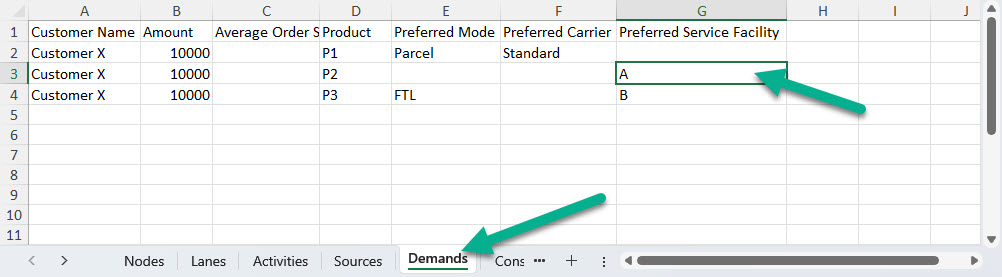
Preferred service facility designation for accurate baseline creation: Modelers can use the "Preferred Service Facility" feature to fix the facility for designated rows in the demand table. "Preferred Service Facility" is an attribute of the demand table. This feature will facilitate creating a baseline scenario from known patterns. All demand rows can be assigned to the actual service facility regardless of optimum path. The new process will be:
-
Import preferred service facility in the demand table:
- Ensure that the named service facility is in the Nodes tab—exact matches are required for data consistency
- Use the same name in the demand tab under the column "preferred service facility"—this can be designated for all rows or some rows can be left blank
-
Upload/import table
-
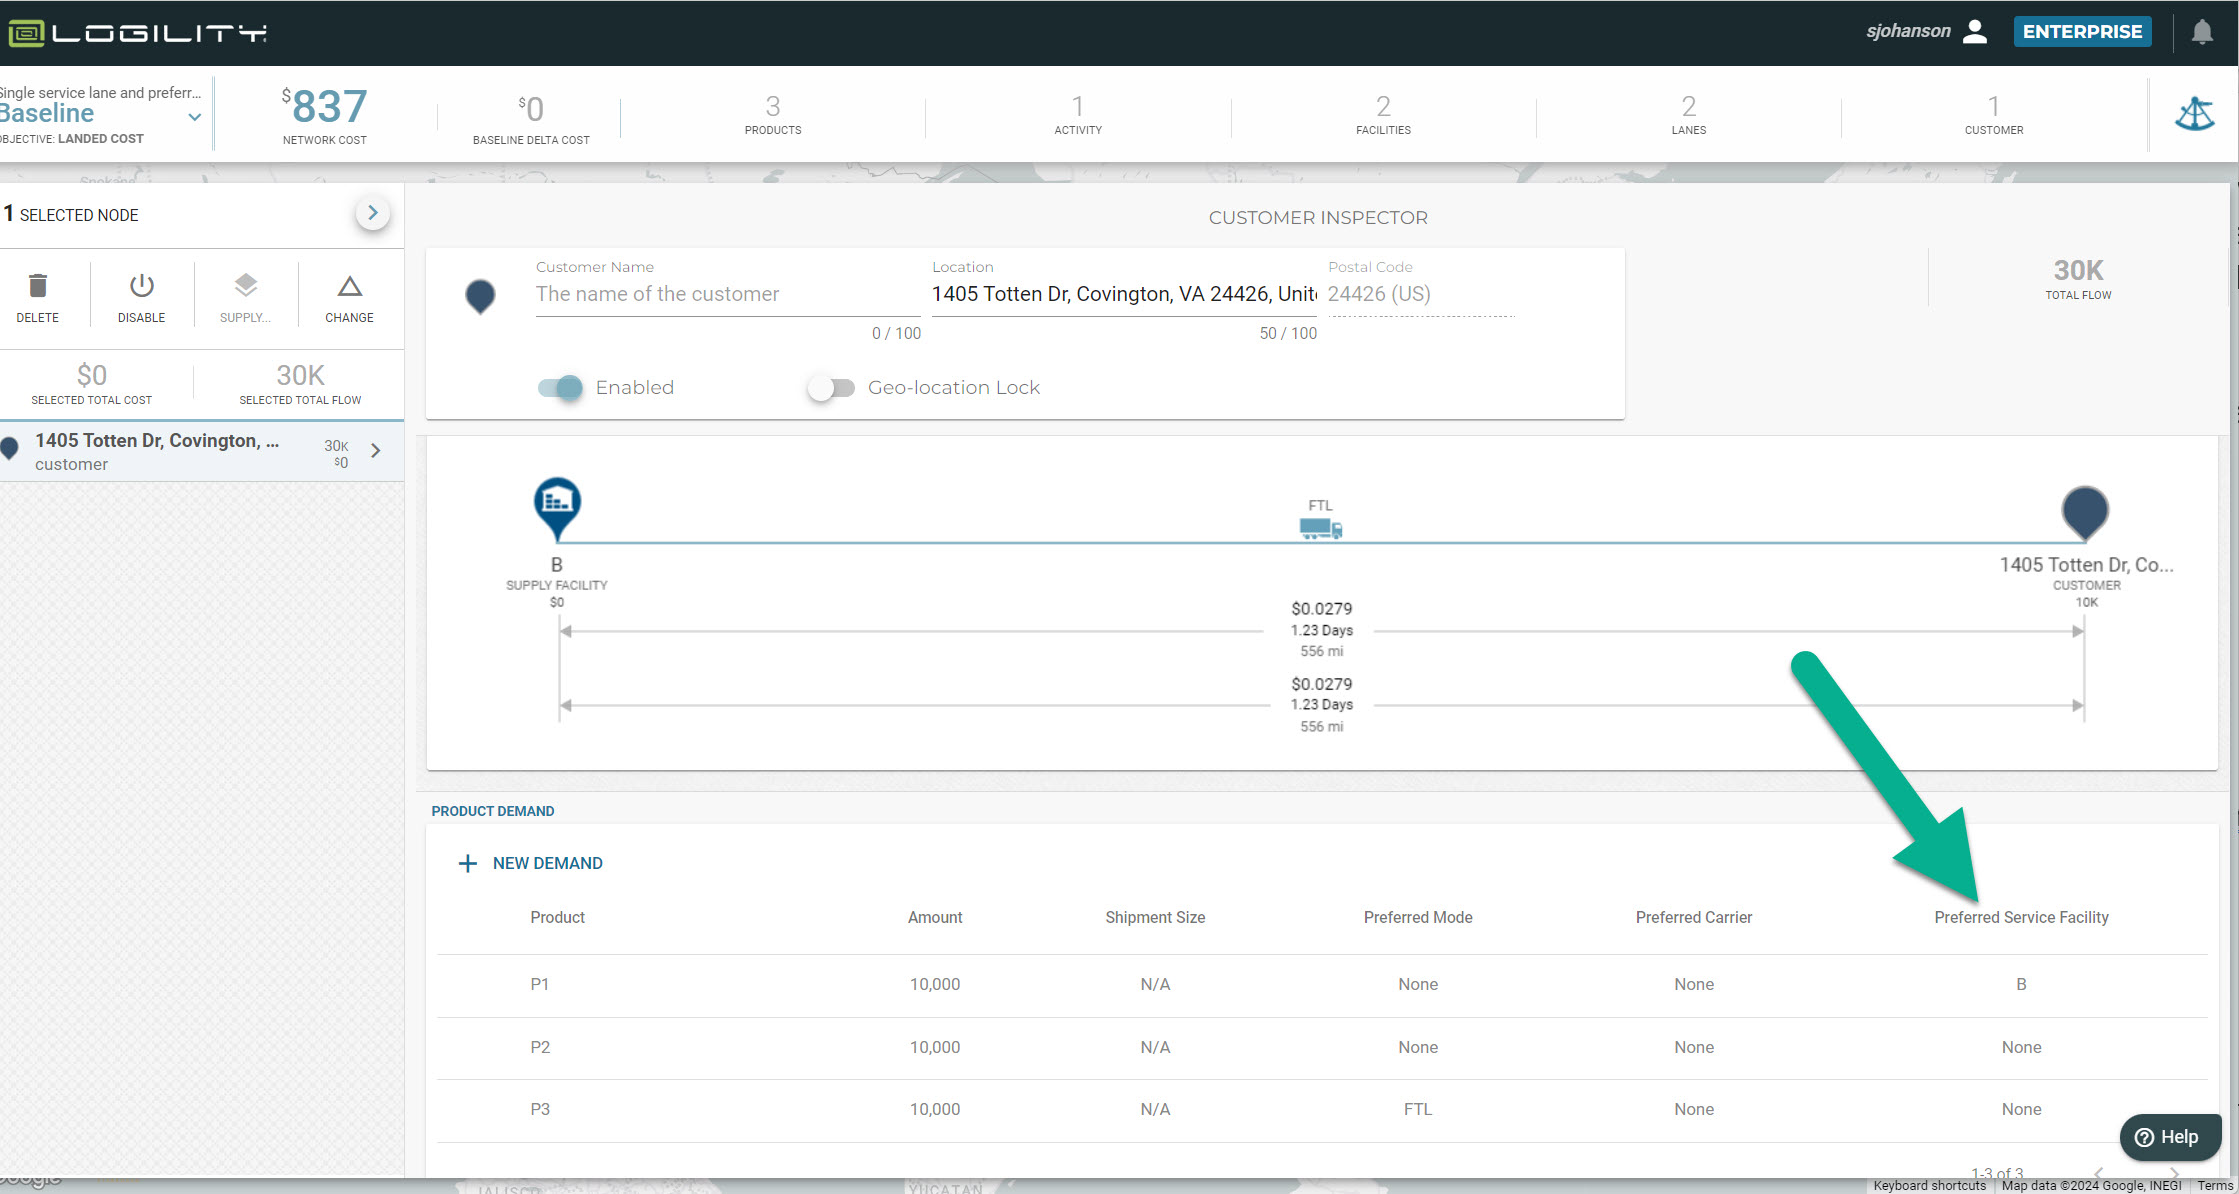
Assign preferred service facility in interface
- Select customer node
- Open inspector
-
Scroll to "Demand" section and select the service facility for designated demand elements
-
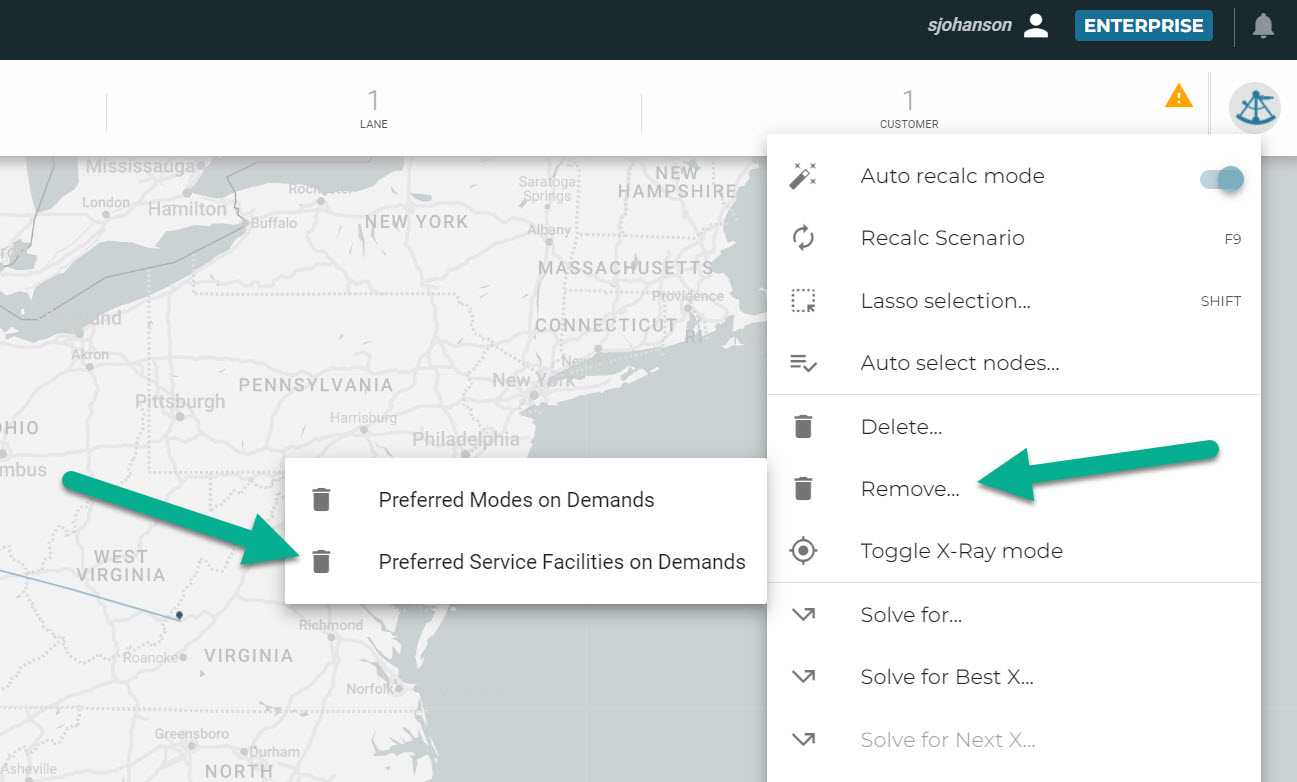
Deleting preferred service facility: A common practice will be to import the PSF in order to create a baseline scenario and then the modeler will wish to free up the assignment in subsequent scenarios:
- Duplicate the scenario with the Preferred Service Facilities
- Remove all Preferred Service Facility assignments: Magic Sextant>>Remove>>Preferred Service Facilities
- ALL Preferred Service Facility assignments will be removed from all demand elements
- Scenario and subsequent solves will optimize without considering Preferred Service Facilities
-
Logic of "preferred service facility"
-
Preferred service facility will supersede the scenario or solver objective—all optimized paths will be ignored in lieu of the preferred service facility
- If a lane from the service facility to the customer is present, that lane will be used to satisfy the demand
- If a solve is run from the solver library, a lane from the preferred service facility to the customer will be created to satisfy that demand
- Deleting/disabling a preferred service facility will cause all demands with that designation to be set to null (removed)
- Deleting/disabling a lane from a preferred service facility to a customer with demand designated for that service facility will cause all demands with that designation to be set to null (removed)
-
Preferred service facility will supersede the scenario or solver objective—all optimized paths will be ignored in lieu of the preferred service facility
-
Rules/Troubleshooting:
- Customers must have a valid inbound lane from a service facility In order to have demand designated as having that Preferred Service Facility
- If a Preferred Service Facility name is changed, the name will be automatically changed in any demand element that references it—the assumption is that the name change should cascade through the scenario
-
Import preferred service facility in the demand table:
- Accelerated scenario duplication: Duplicating a scenario within a model will not require a solver to run. This will allow faster creation of new scenarios and improve modeler’s productivity.
Release Date: 4 February 2024
Summary
- New method for exporting Detail and Summary Reports
- Enhanced API to support large scale Summary Reports
Here is what you will see:
-
New method for exporting Summary Reports: Generatng the Detail and Summary Reports (magic sextant>>Reports) will now be able to choose which scenarios to include in the report. This way extraneous scenarios can be excluded and extremely large models can be managed for higher row counts. The new process is:
- Select summary reports (magic sextant>>Reports>>Summary Reports)
- Chose scenarios to include
- Click Generate
- Enhanced API to support large scale Summary Reports: Summary Reports can be very large (over 20MB). The selector feature listed above allows the modelers to reduce the overall size. The enhanced API will now allow for the creation of larger files (~100MB).
Release Date: 20 January 2024
Summary
- improved solve for "single service lane"
- embedded knowledgebase for most commonly viewed articles
- client service portal integration
- importing nodes now verify their locations to ensure they can be connected and costed
- minor fixes and optimizations
Here is what you will see:
-
Improved solve for "single service lane": Now you can opt to have a customer be serviced by only one service facility. This will create a single lane to the customer that services all products and demand. WARNING: Solving for a single service lane (single service facility) will often create an infeasibility as the criteria requires at least one facility to have access to all products demanded by the customer. The solver has been improved to reflect complex BOM and upstream supplier interactions.
-
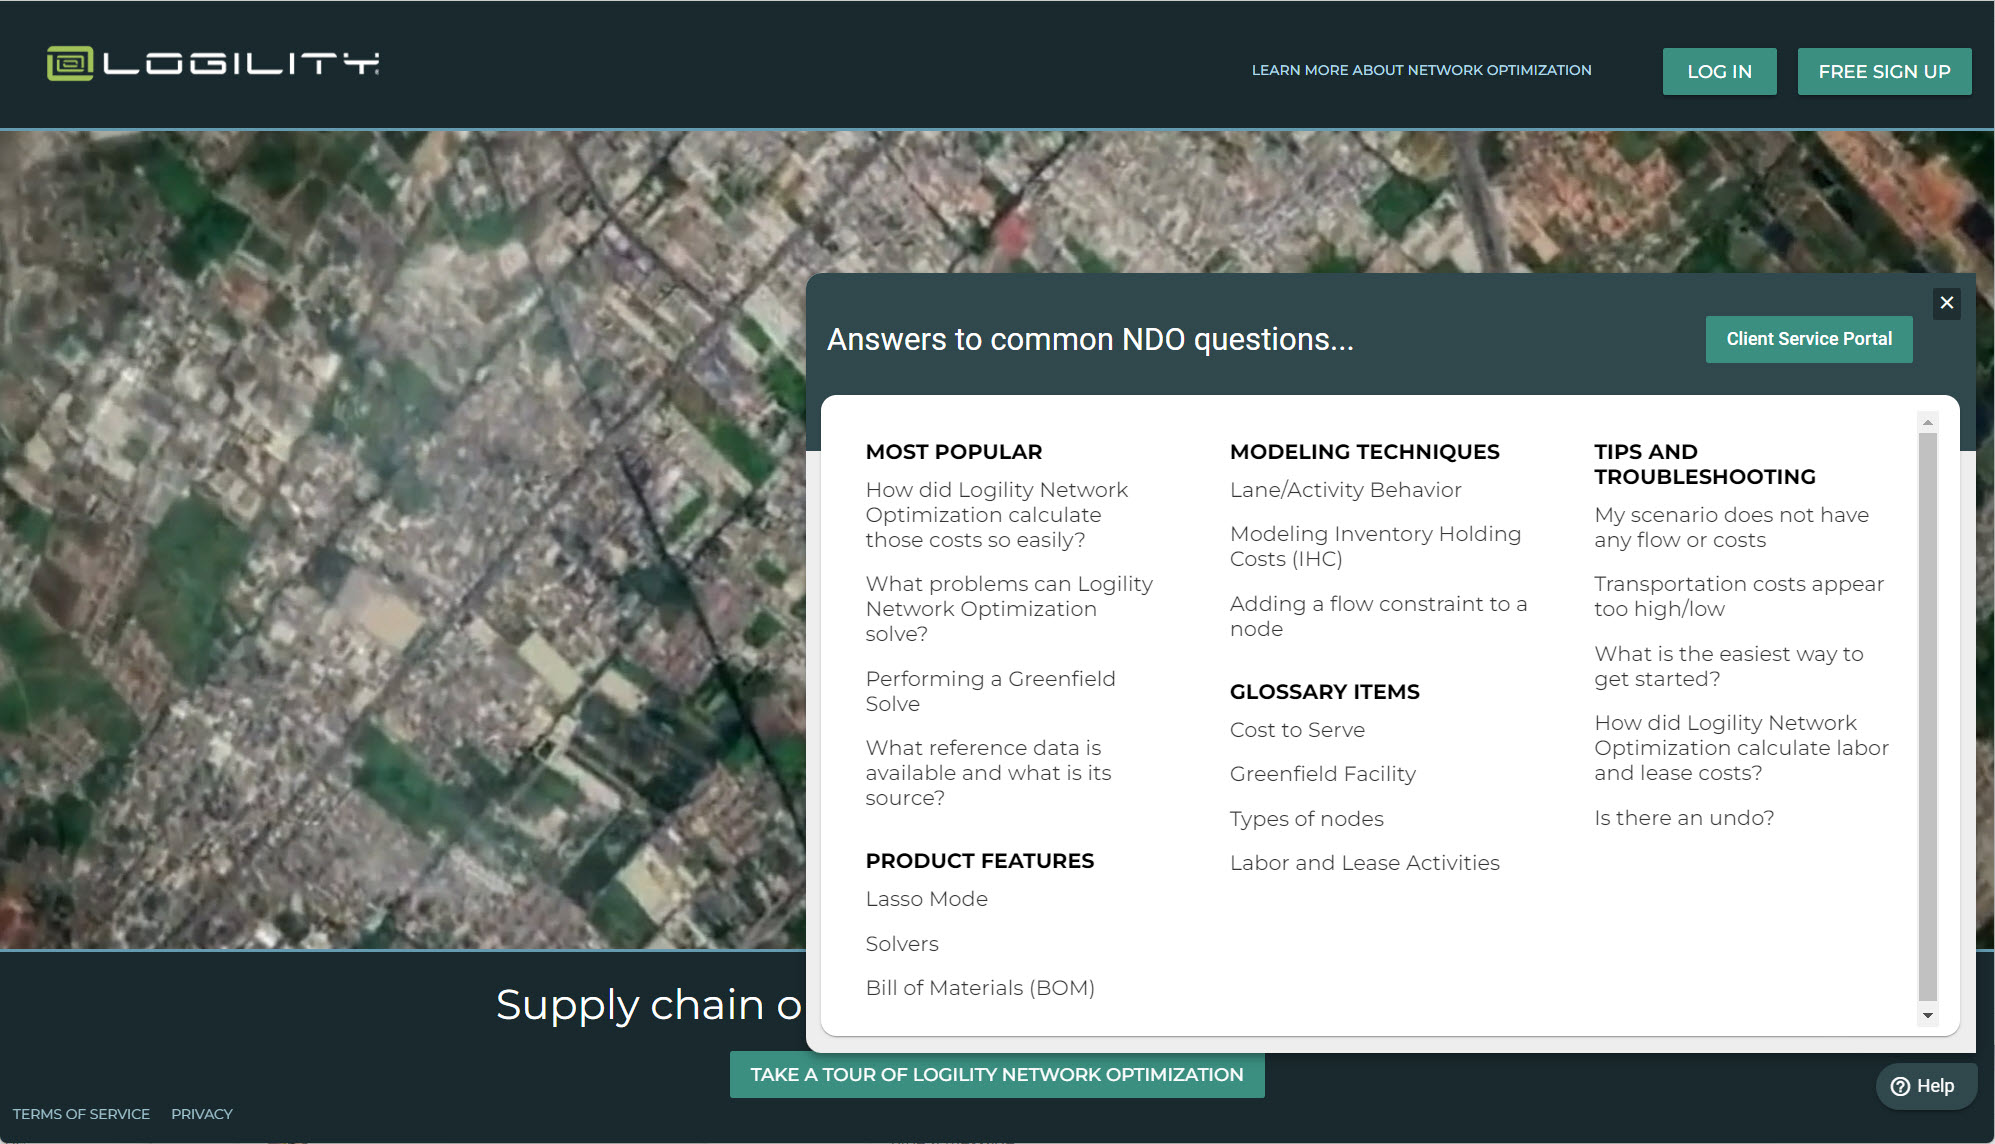
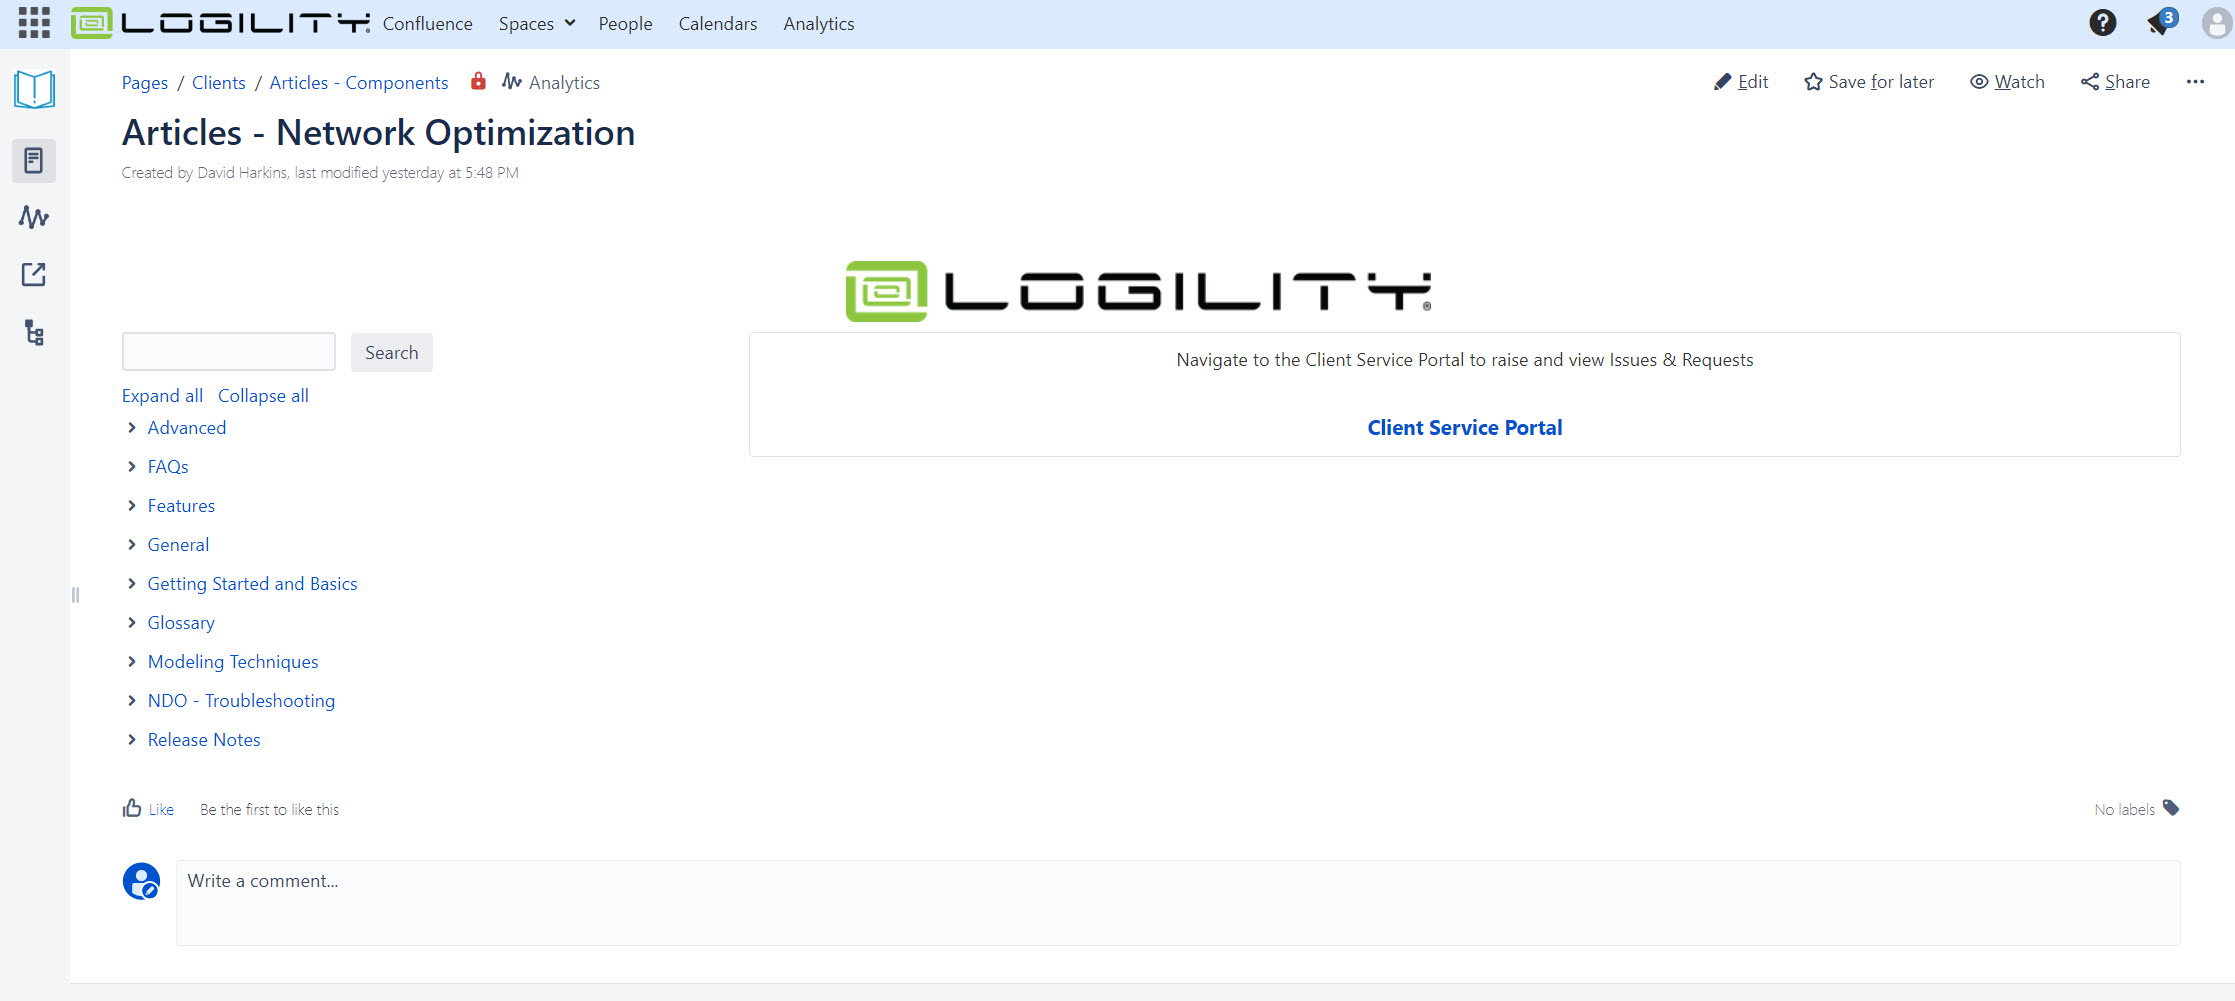
Embedded knowledgebase for most commonly viewed articles: The help widget will now open with direct links to the most common questions.
-
Client service portal integration: Subscribing clients can access the Logility Client Service Portal through a link in the help widget. This will be a separate sign in but will allow full access to the knowledge base as well as the trouble ticket system. Follow the link "Client Service Portal" from the help widget and create your account. You can also go straight to this link to see the view below
- Importing nodes now verify their locations to ensure they can be connected and costed: Some geographies will not return country or postal code information when plotted by Logility's geocoding systems. These are rare in places like Western Sahara or parts of Kashmir. Logility Network Optimization will still plot these and allow FTL f(x) or Ocean lanes to connect nodes in these regions.
- Minor fixes and optimizations: Several changes have been made to speed up the data processing actions such as importing, solving, copying models and scenarios, and sharing models and scenarios.
Release Date: 08 October 2023
Summary
- added ability to solve for a single service lane (only one service facility to a customer)
- added infeasibility indicators to nodes and lanes in the selected node list
- added the ability to automatically select infeasible nodes and lanes from the magic sextant
- minor fixes and improvements
Here is what you will see:
-
Ability to solve for a single service lane (one distribution point to a customer): Now you can opt to have a customer be serviced by only one service facility. This will create a single lane to the customer that services all products and demand. WARNING: Solving for a single service lane (single service facility) will often create an infeasibility as the criteria requires at least one facility to have access to all products demanded by the customer.
-
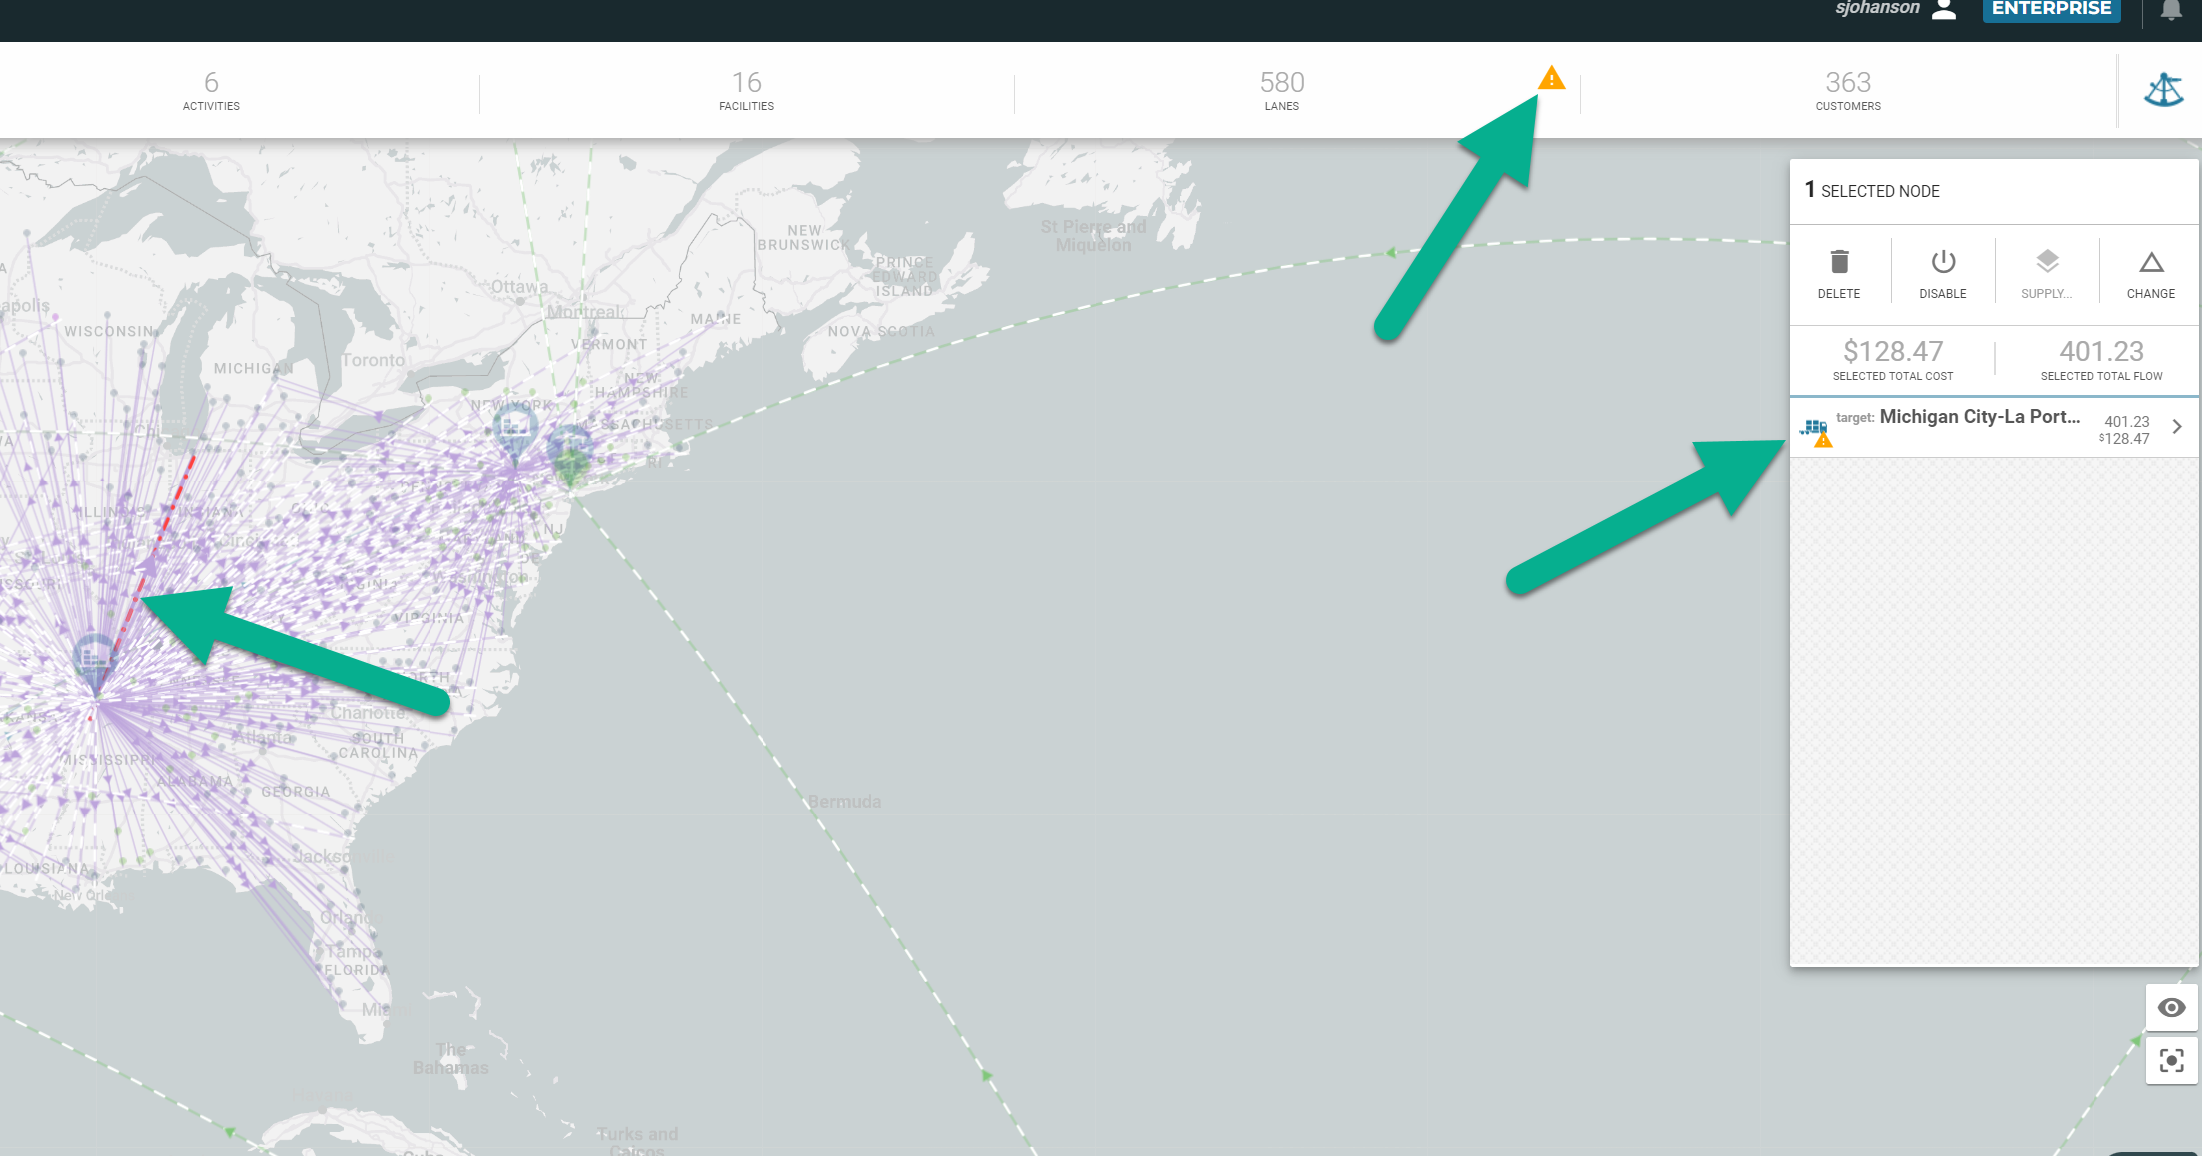
Infeasibility indicators to nodes and lanes in the selected node list/Select Infeasibility/indicator in item selector: Now a user can track down an infeasibility by seeing a visual indicator on the map (red line). Selecting the infeasibility warning in the scoreboard (yellow triangle), and seeing the warning repeated when an item is selected in the inspector.
Release Date: 20 August 2023
Summary
- Added service distance as an objective
- fixed an issue where some users were experiencing a 400, browser error
- Improvements to the speed and reliability of geocoding
- Clarification of optimization around "selected" node and fixed costs
- Other minor fixes
Here is what you will see:
-
Customer service distance as an objective: Now you can solve for service distance to the customer as an objective. This feature can be used in a number of different ways. It can be used to model a business rule where a customer site needs all products to be shipped from the closest service facility.
- Fix to 400 Browser Error: Many users would get a 400 error in their browser. A configuration bug was corrected and should not be causing this error. Users may very rarely experience this in the case of a corrupted token. Resolution is to clear the browser cache and re-log in. Please report when this happens.
- Improvements to speed and reliability of geocoding: Recent changes in our hosted environment as well as changes in the Here.com platform allowed a refactoring of the geocoding and reverse geocoding. These processes should be faster and have a higher reliability.
- Clarification of solving for selected nodes when a fixed cost is present: When a user selects nodes and Solves for "selected" or "Solve for Next X..." The assumption will be made that the modeler intended to use these nodes regardless of any fixed costs impact. In other words, if a modeler selects 3 nodes, solves for selected and minimum cost--the three warehouses will be retained even if the low cost solution is to open only 2 of 3 warehouses.
Release Date: 3 July 2023
Summary
- Move to Neo4J Graph database
- CO2 as a metric and objective
- Clustering of customer nodes on map
- Whole model import/export
- Enable/disable automatic calculations
- Master Report export and xlsx format
- Composite activity format
- Infeasibility reporting for flow constraints
- Mixed mode delivery to customers
New URL: ndo.mylogility.com
End of Life for Old URL: TBD
Here is what you will see:
-
Graph Database: the platform now runs 100% on the Graph Database. For those of you who do not know, Graph is a next generation data storage and access system. It surpasses relational databases in its ability to represent more complex models and opens the door for deeper analysis, easier integrations, and inclusion of AI and ML methods in the future. For now, look for the ability to load bigger datasets, and speed improvement in solving and rendering.
-
CO2 Emissions: Check out the ability to assign emissions to any activity in any node. Also see that our reference data includes common coefficients to calculate freight emissions by mode. You will also be able to optimize for CO2—find the minimum or set a target cap. Try this, go to the sextant and find this solver:
-
Clustering of Customer Nodes: Did you find that your browser was slow with 6,000 customer nodes? Now take a look, if you have over a threshold of 1000 customers, you will see that we cluster them for you to reduce the load on the browser and make your experience more interactive. Just zoom in to see the detail:
-
Model Export/Import: Have you ever wanted to edit a model’s configuration and BOM tables in a spreadsheet? Try this, export a model (sextant>>export>>model). And you will see a complete export. It is a zip file with all scenarios and model configuration settings. Make edits and then re-import as a new model.
-
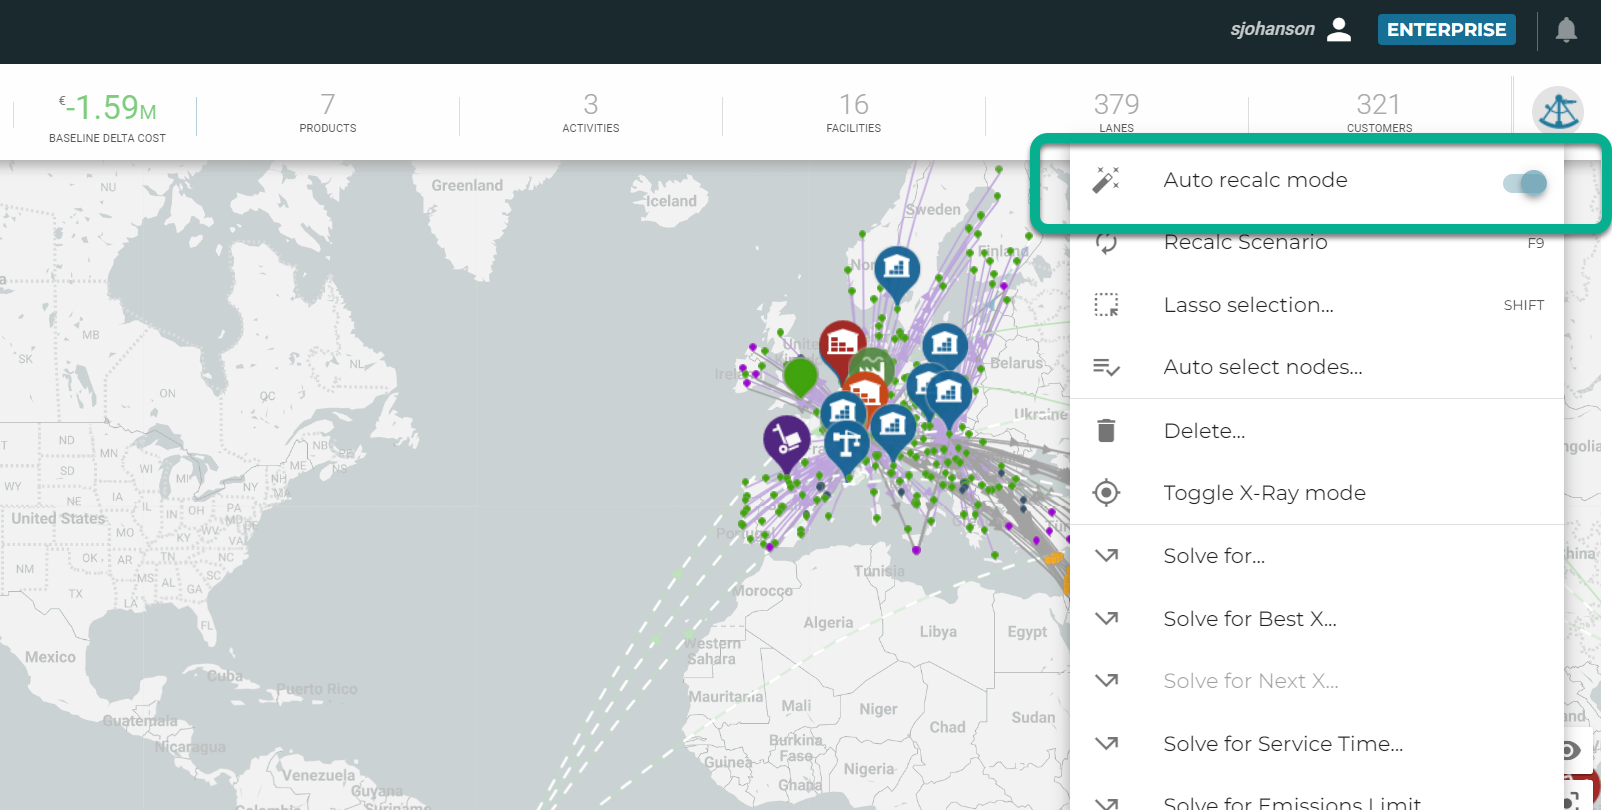
Enable/Disable Auto-calculation: For those of you who like to make a number of changes in the visual interface but don’t want to wait for the scenario to re-optimize after every move, try this: Go to the sextant and toggle auto-recalc mode off! Now make a bunch of changes and THEN trigger a recalculation.
-
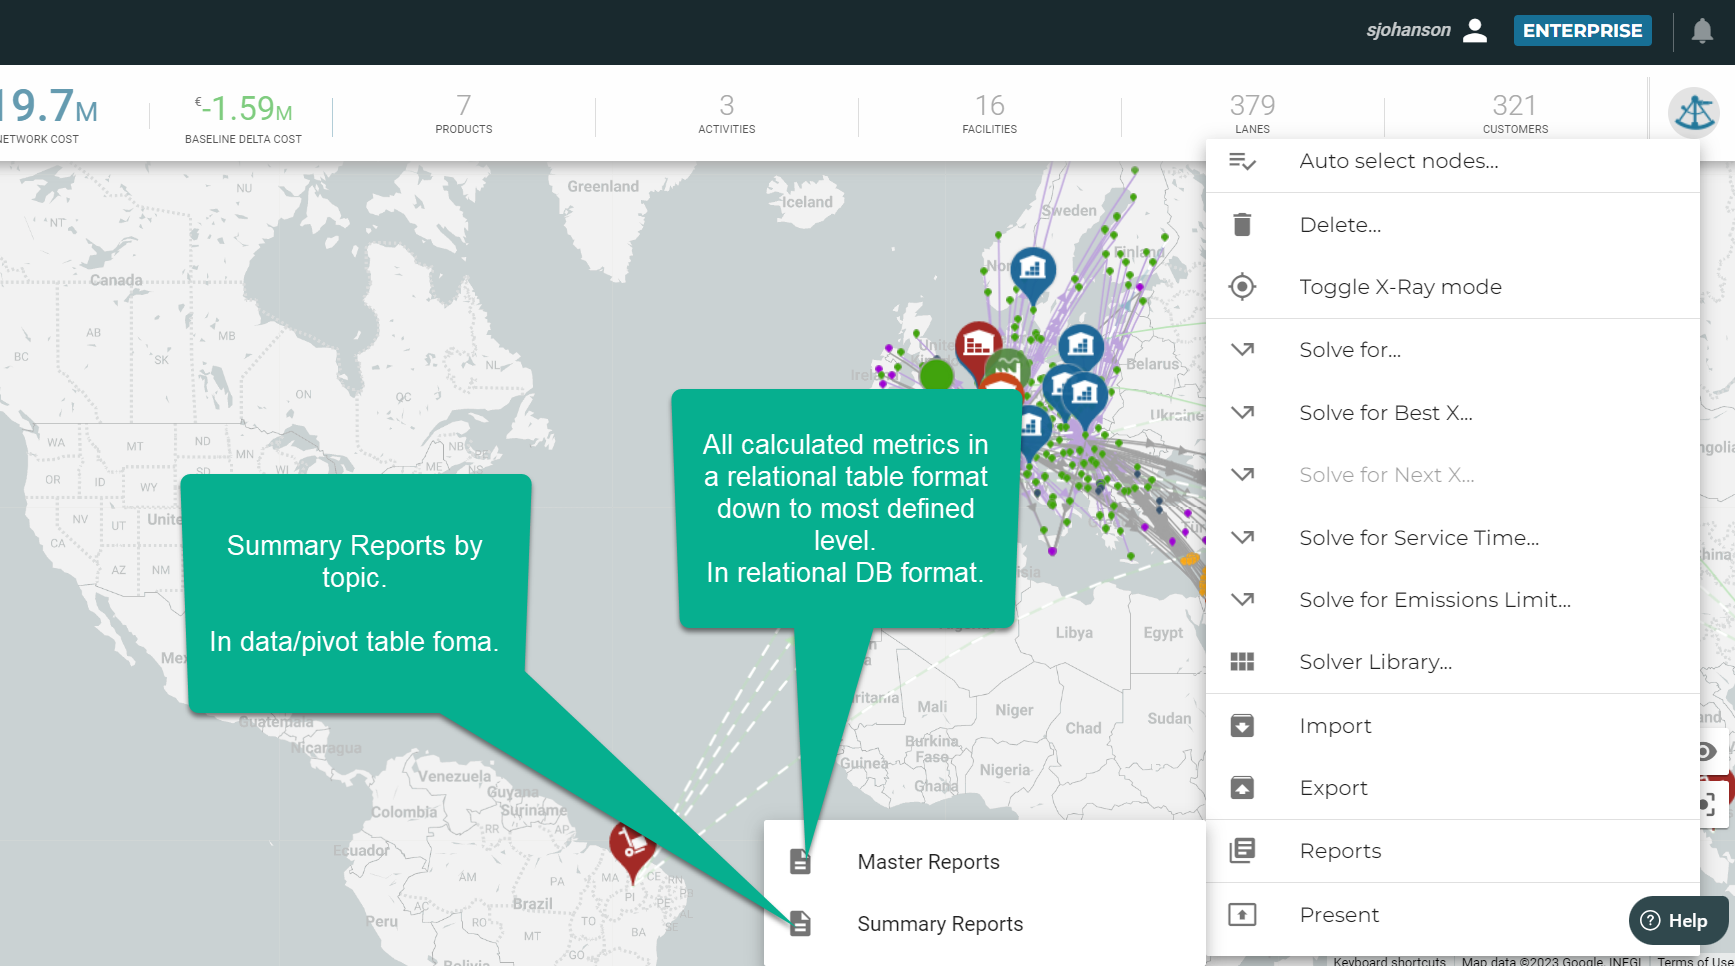
Reports: Reports now include a complete export of a model in relational database tables. Use this to populate a database or other BI system and create custom reports using all available data from the model. These reports are also in xlsx form so can be up to 1MM rows. Go to sextant>>reports and pick either "Master Reports" or "Summary Reports":
-
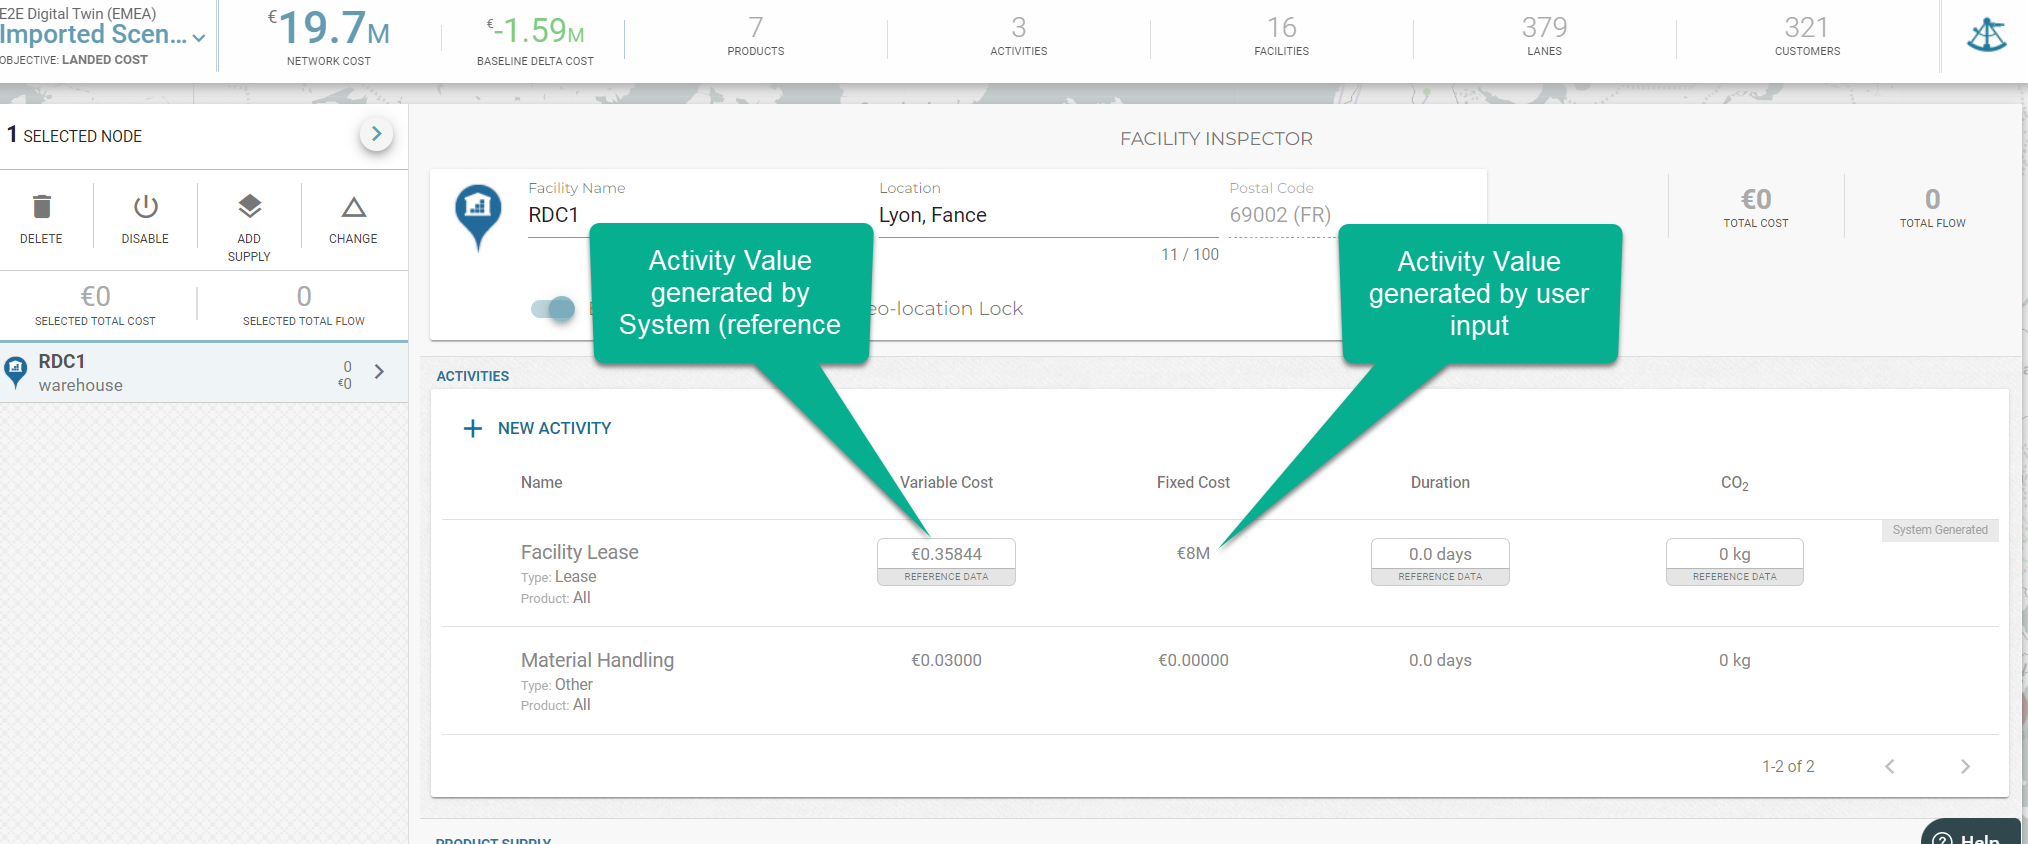
Composite Activity Format: Activities are now condensed into a single row of data in the interface and on the scenario import export. You can now create hybrids of “system generated” activities that are driven by reference data and user controlled.
-
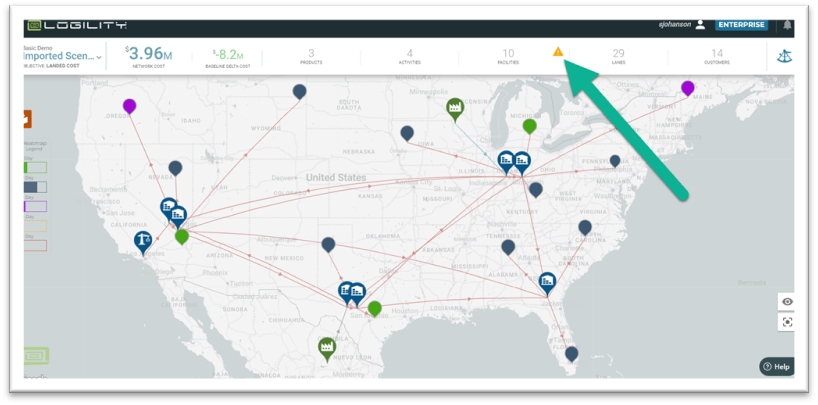
Capacity Constraints and infeasibility reporting: You can now see what constraints are infeasible. In the event of infeasibilities, the solver will return a solution and you can see a warning icon that indicates the node or the lane where the infeasible constraint exists. It will also be identified on the map. Look for the warning in the scoreboard:
Other Things to Know
- Existing models can be opened in the new site and all data will be converted to the updated format. Once the model is converted, any changes made to the model or scenario in either environment are isolated from each other. Note, the legacy url (www.starboardcorp.com) will be forwarded to the new URL after 30 September 2023.
- You may see changes in solving with constraints and fixed costs in the scenario. NDO now treats fixed costs with a more accurate allocation and constraints that cause infeasibilities will be relaxed and reported in the scoreboard.
- Any users who are on the Beta (test) site will need to export models (sextant>>export>>model) and re-import into the new URL. Thank you for helping us prove out this major release.
- Demand data can be loaded with a "preferred mode". This mode will supersede the mode on the inbound lane. And the feature can be used to serve customers by a variety of modes.